Crypto RSI API — Relative Strength Index Data
Access crypto RSI (Relative Strength Index) data via API. Get RSI values, zone classifications, trend analysis, and momentum signals — all calculated and ready to power your trading strategies, technical analysis, or automated systems.
- • Real-time RSI14 calculations
- • RSI zone classification (bullish/neutral/bearish)
- • RSI trend and momentum analysis
- • Historical RSI data access
- • Structured JSON responses
- • Free automation templates using RSI data
Part of our broader crypto indicators API — access RSI, momentum signals, and more technical indicators.
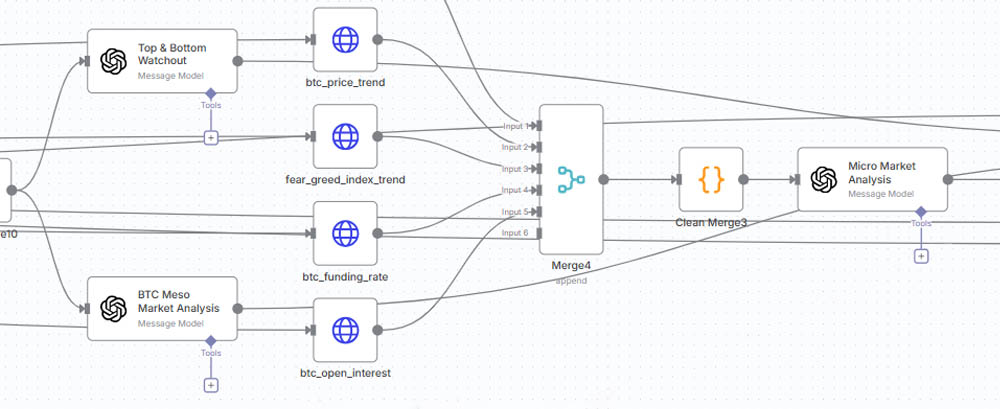
Build RSI-Based Automations
Free n8n templates that use our crypto RSI API to generate RSI alerts, momentum signals, and trading insights — no programming required.
Note: You need an n8n account (free self-hosted or paid cloud) to use these templates.
API — RSI Endpoints
Access RSI14 data, zone classifications, trend analysis, and momentum signals via REST API. Perfect for technical analysis and RSI-based trading strategies.
See Our RSI API in Action
Follow our automated technical analysis on X and Substack — all powered by RSI and other technical indicators from our API.


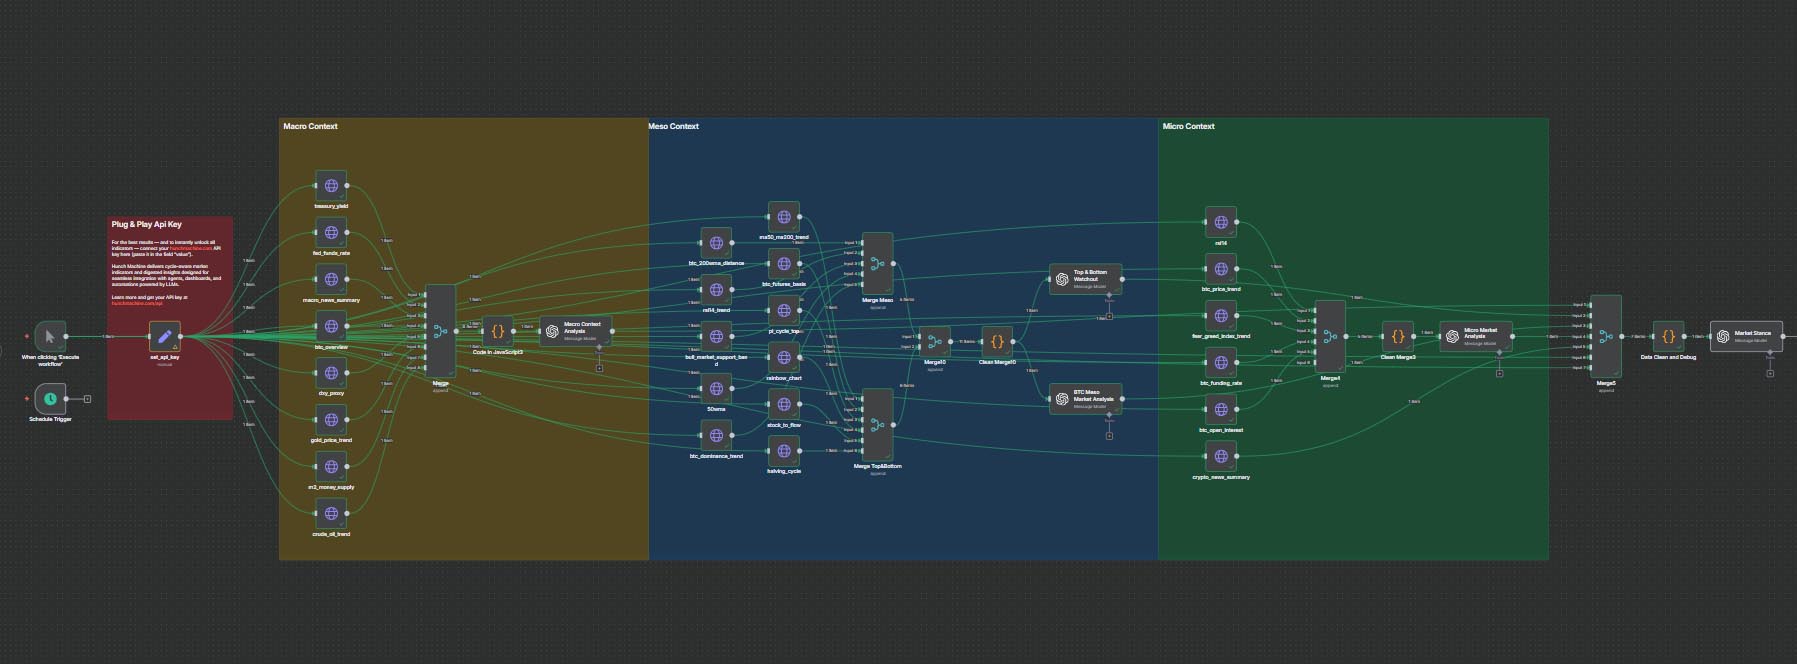
Build with Our RSI API
Ready-to-use automation templates powered by our crypto RSI API and other technical indicators. Copy, customize, and deploy — real-time RSI data included.
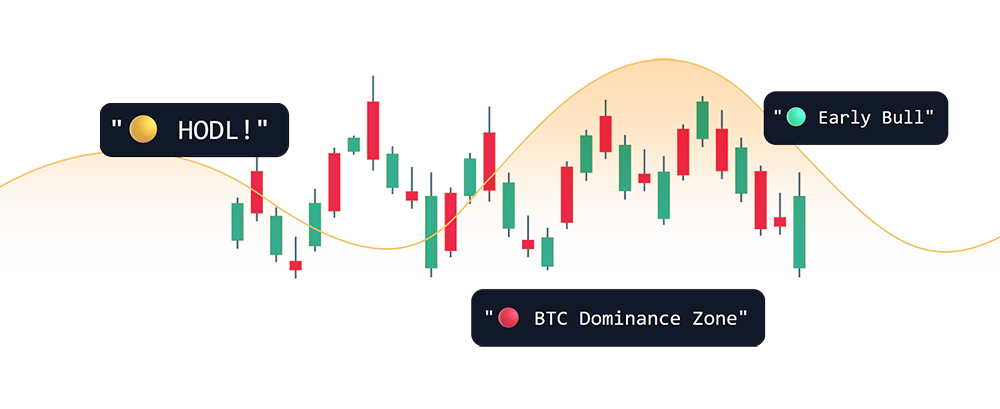
Crypto Investment Insight
Your AI market analyst. Studies the entire crypto market daily to help you make better medium-term decisions: when to accumulate, hold, or step aside.
View more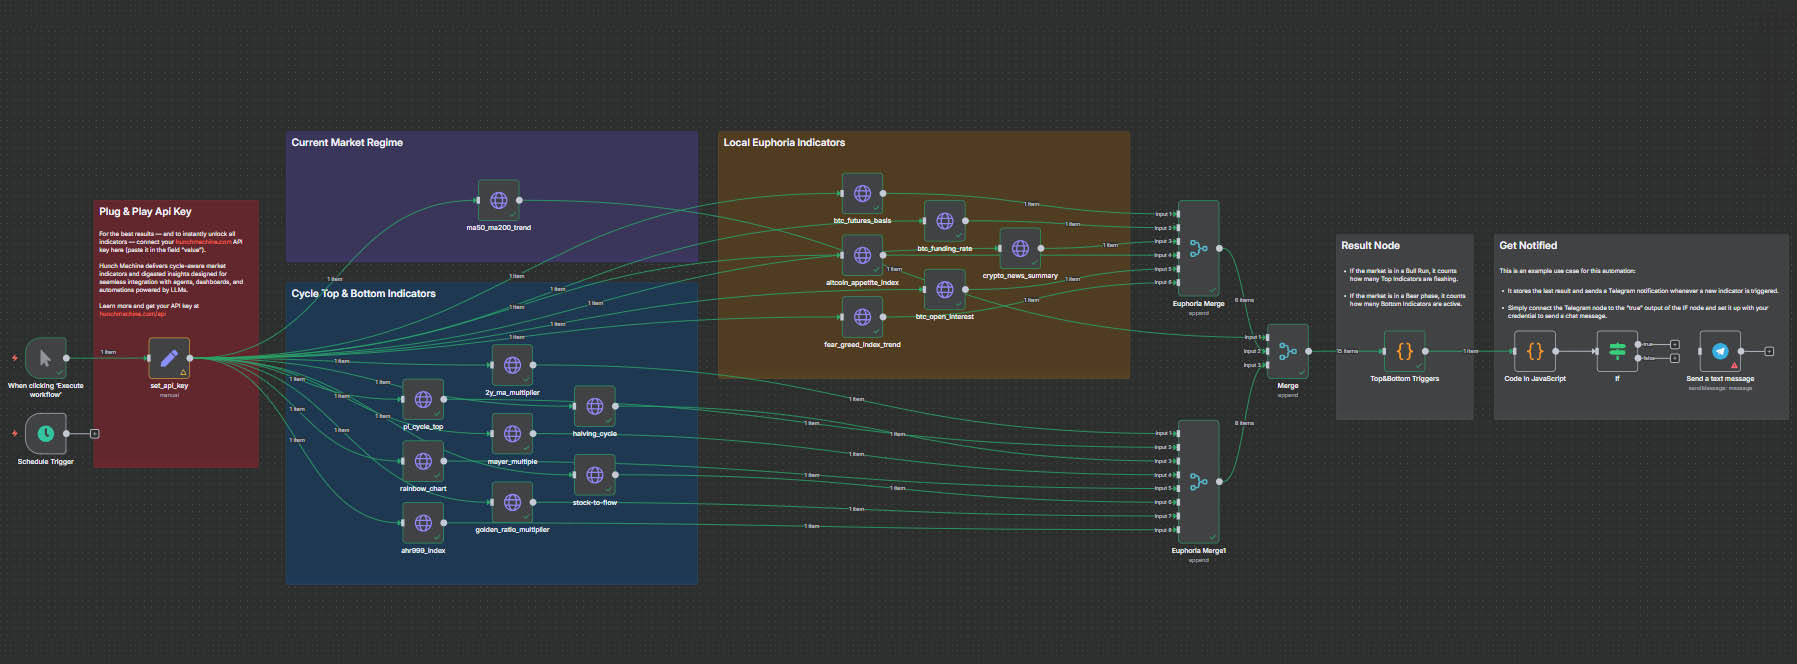
Crypto Top & Bottom Detector
Monitors key indicators to detect cycle tops and macro bottoms. In bull markets, it tracks top signals; in bear markets, it identifies bottom opportunities.
View more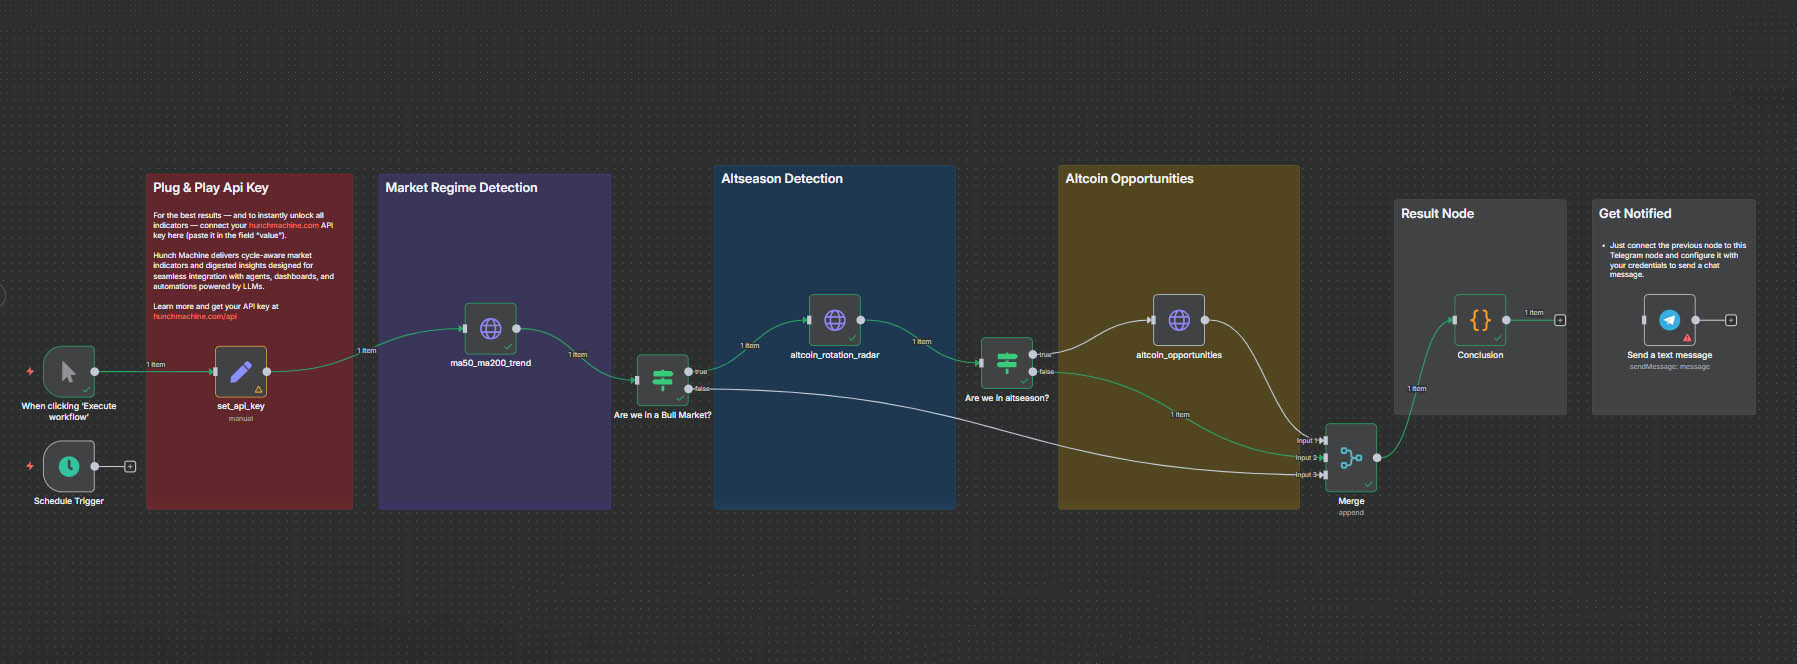
Altcoin Opportunities Detector
Scans the market for short-term altcoin setups during expansion phases. Identifies coins with early strength, momentum, or recovery potential based on real-time analysis.
View moreUse Cases
Use RSI data from our API to build momentum-based trading strategies and overbought/oversold detection systems.
Set up automated alerts using our API that trigger when RSI reaches overbought (>70) or oversold (<30) levels.
Pull RSI data from the API to generate technical analysis reports and momentum insights automatically.
Feed RSI data from our API to your trading bots to make momentum-aware trading decisions.
FAQ
RSI is a momentum oscillator (0-100 scale) that measures the speed and magnitude of price changes. Values above 70 typically indicate overbought conditions, while values below 30 suggest oversold conditions.
API has paid tiers. Automation templates that use the API are free.
No. You can use our free automation templates with zero coding, or access the API directly if you prefer.
The API delivers RSI14 values, zone classifications (bullish/neutral/bearish), trend analysis, momentum signals, historical RSI data, and structured JSON responses with timestamps.
Use it in RSI-based trading strategies, alert systems, technical analysis tools, research reports, or any custom application via REST API.
Use our free n8n automation templates. They pull RSI data from our API and generate RSI alerts, momentum signals, and trading insights. Copy the template, add your API key, and run.
Access RSI14 endpoint at /api/rsi14-api and RSI14 trend endpoint at /api/rsi14-trend-api. The API provides RSI values, zone classifications, trend analysis, and more. All responses are structured JSON.
BTC, ETH, major alts — with more markets coming soon.
Yes — follow our X and Substack accounts. All technical analysis is generated using RSI and other indicators from our API.
API limits depend on your plan. Automation templates = unlimited.
Yes — our API includes multiple technical indicators including momentum signals, trend analysis, and more. Explore all endpoints at /api or check out our crypto indicators API.