Which Bitcoin indicators are best?

When people ask "Which Bitcoin indicators are best?", they're usually trying to understand which technical tools can help them read market structure, identify trends, and time entries and exits more effectively.
There's no single "best" indicator. The answer depends on what you're trying to measure: trend direction, momentum shifts, volatility conditions, or volume flow. Most traders combine several indicators to build a comprehensive view, using different tools for different timeframes and objectives.
This article covers:
- Why indicators matter and how to think about them
- Core trend indicators for identifying direction
- Momentum tools for detecting strength and reversals
- Volatility gauges for risk assessment
- Volume and flow indicators for confirming moves
- Short-term vs cycle indicators and when to use each
- Best-practice combinations for balanced analysis
Why indicators matter
Technical indicators help you read market structure without relying solely on price action. They process historical data to reveal patterns, momentum shifts, and potential reversal zones that might not be obvious from raw price charts.
The challenge is that no single indicator is perfect. Each tool measures something specific: trend direction, momentum strength, volatility levels, or volume flow. Markets are complex, and different conditions require different tools. A trend indicator might work well in a strong directional market but fail in sideways consolidation. A momentum oscillator might catch overbought conditions but miss the start of a new trend.
This is why most traders combine multiple indicators, using them to confirm each other rather than relying on a single signal. The key is understanding what each indicator measures and when it's most useful. Understanding how Bitcoin indicators work helps you interpret what they're measuring and why those measurements matter.
Short-term vs cycle indicators
Before diving into specific tools, it's worth distinguishing between indicators designed for short-term trading and those better suited for cycle analysis.
Short-term (micro) indicators focus on immediate market conditions: current momentum, recent volatility, short-term trend direction. These are useful for day trading, swing trading, or timing entries within a broader trend. Examples include 14-period RSI, short-term moving averages (50-day, 200-day), and intraday volume patterns.
Cycle (meso/macro) indicators focus on longer-term market structure: multi-year cycles, major trend phases, cycle tops and bottoms. These help with strategic positioning, accumulation phases, and major exit points. Examples include the 200-week moving average, MVRV Z-Score, and halving cycle analysis.
The distinction matters because different timeframes require different tools. A short-term RSI reading might show overbought conditions while cycle indicators suggest the bull market is still early. Understanding both layers helps you avoid getting whipsawed by short-term noise while missing larger structural shifts.
Core trend indicators
Trend indicators help you identify the direction of market movement and potential trend changes. They smooth out price action to reveal underlying direction, making it easier to see whether the market is trending up, down, or moving sideways.
Moving averages (SMA/EMA)
Moving averages are among the most fundamental trend indicators. They calculate the average price over a specific period, smoothing out short-term fluctuations to reveal the underlying trend direction.
Simple Moving Average (SMA) calculates the arithmetic mean of closing prices over a set period. A 50-day SMA, for example, adds up the last 50 closing prices and divides by 50. It's straightforward but gives equal weight to all prices in the period.
Exponential Moving Average (EMA) gives more weight to recent prices, making it more responsive to current market conditions. The EMA reacts faster to price changes, which can help you catch trend shifts earlier, but it can also generate more false signals in choppy markets.
How to use moving averages:
- Trend identification: Price above the moving average suggests an uptrend; below suggests a downtrend
- Crossover signals: When a shorter EMA (like 50-day) crosses above a longer EMA (like 200-day), it's called a "golden cross" and often signals the start of an uptrend. The opposite is a "death cross"
- Support and resistance: Moving averages often act as dynamic support in uptrends and resistance in downtrends
- Multiple timeframes: Using moving averages on different timeframes (daily, weekly, monthly) helps you see both short-term and long-term trends
For cycle analysis, the 200-week moving average acts as a key structural level. Historically, Bitcoin has found support at the 200W MA during bear markets and accumulation phases. When price trades well above the 200W MA, it often signals late bull market conditions. When price is well below, it typically marks deep accumulation zones.
The 50-week moving average provides medium-term trend context. Sustained price action above the 50W MA has historically marked strong bull markets, while prolonged periods below have indicated major bear phases.
MACD
The Moving Average Convergence Divergence (MACD) is a trend-following momentum indicator that shows the relationship between two exponential moving averages. It's calculated by subtracting the 26-period EMA from the 12-period EMA, creating the MACD line. A 9-period EMA of the MACD line creates the "signal line," and the difference between them forms the histogram.
How MACD works:
- MACD line: The difference between fast and slow EMAs, showing momentum direction
- Signal line: A smoothed version of the MACD line, used to generate crossover signals
- Histogram: The difference between MACD and signal lines, showing momentum acceleration or deceleration
MACD signals:
- Bullish crossover: When the MACD line crosses above the signal line, it suggests upward momentum is building
- Bearish crossover: When the MACD line crosses below the signal line, it suggests downward momentum is building
- Divergence: When price makes new highs but MACD makes lower highs (or vice versa), it can signal weakening momentum and potential reversals
- Zero line cross: When MACD crosses above zero, it suggests the trend has shifted to bullish; below zero suggests bearish
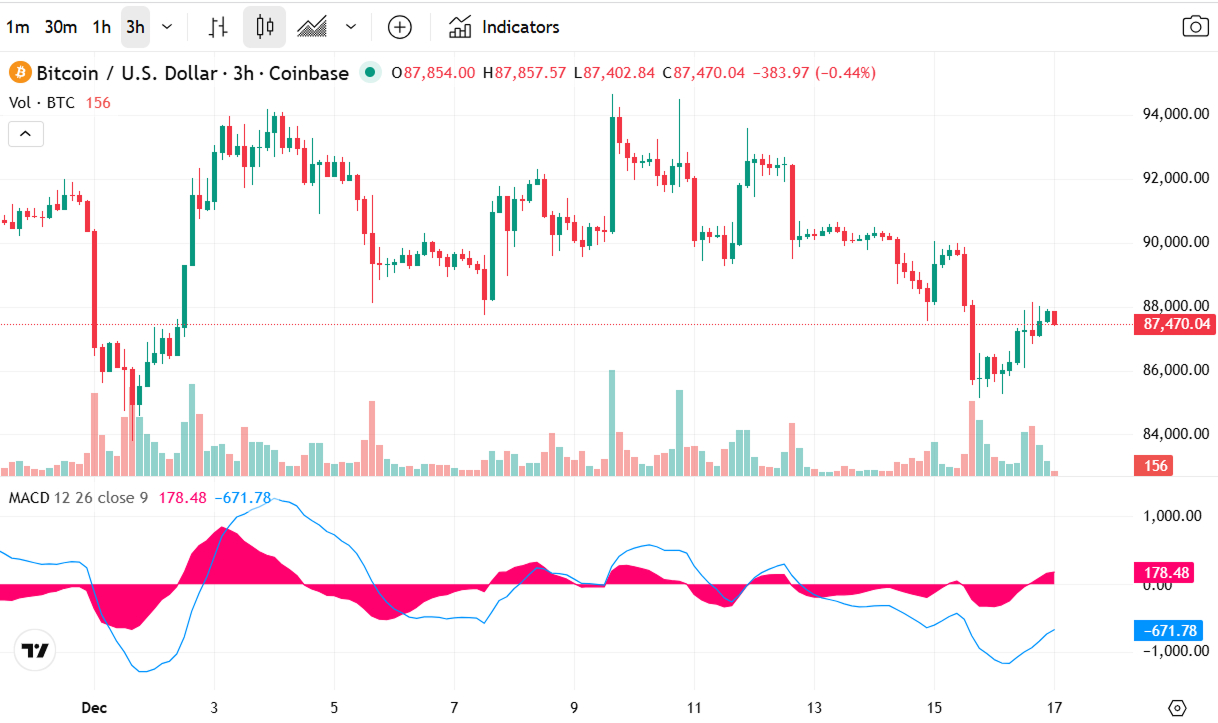
MACD is particularly useful for identifying momentum changes within a trend. It helps you recognize when a trend is strengthening, weakening, or potentially reversing, even while price continues in the same direction.
Momentum tools
Momentum indicators measure the speed and strength of price movements. They help identify overbought and oversold conditions, potential reversal zones, and whether current momentum is sustainable.
RSI (Relative Strength Index)
The Relative Strength Index (RSI) is a momentum oscillator that measures the speed and magnitude of price changes. It ranges from 0 to 100, with readings above 70 typically considered overbought and readings below 30 considered oversold.
How RSI works:
RSI compares the magnitude of recent gains to recent losses over a specified period (commonly 14 periods). The formula creates a normalized score that oscillates between 0 and 100, making it easy to compare momentum across different assets and timeframes.
RSI interpretation:
- Above 70 (overbought): Suggests the asset may be overextended and due for a pullback. However, in strong trends, RSI can stay overbought for extended periods
- Below 30 (oversold): Suggests the asset may be oversold and due for a bounce. In downtrends, RSI can stay oversold for extended periods
- 40-60 range (neutral): Balanced momentum, neither overbought nor oversold
- Divergence: When price makes new highs but RSI makes lower highs (bearish divergence), or price makes new lows but RSI makes higher lows (bullish divergence), it can signal potential reversals
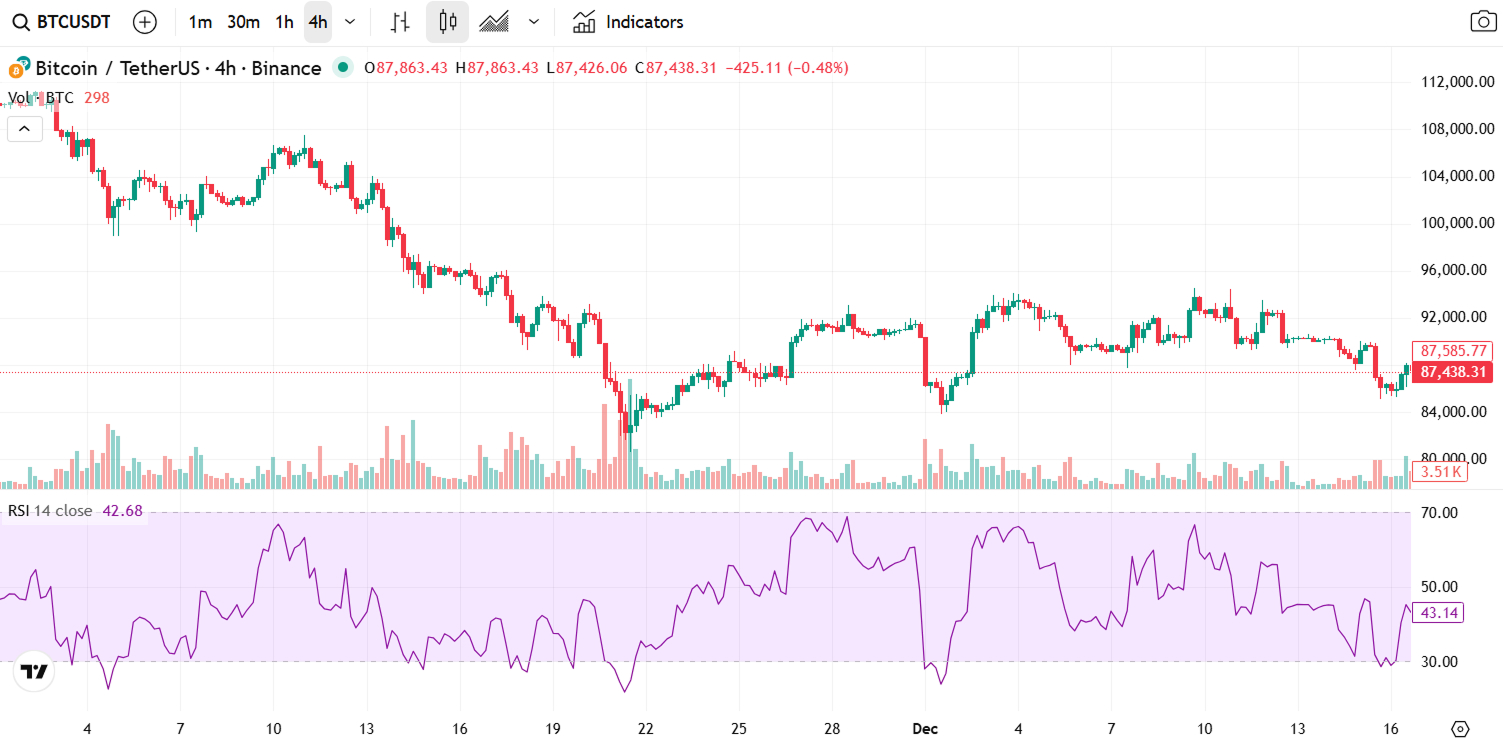
For short-term analysis, the 14-period RSI provides quick momentum assessment. It helps identify overbought/oversold conditions and potential reversal zones within the current trend.
For cycle analysis, the RSI 14 Trend on weekly timeframes provides momentum context for longer-term positioning. Weekly RSI readings above 60 often coincide with strong bull market phases, while sustained readings below 40 can indicate bear market conditions.
How RSI complements trend indicators:
RSI works best when combined with trend indicators. In an uptrend, RSI staying above 40-50 suggests healthy momentum. In a downtrend, RSI staying below 50-60 suggests continued weakness. Using RSI alone can generate false signals in strong trends, but combining it with moving averages helps filter out noise.
Stochastic Oscillator
The Stochastic Oscillator is another momentum indicator that compares the current closing price to the price range over a specified period. It ranges from 0 to 100, with readings above 80 considered overbought and below 20 considered oversold.
How Stochastic works:
The indicator calculates where the current price sits relative to the high-low range over a set period (commonly 14). It generates two lines: %K (the raw value) and %D (a smoothed version of %K).
Stochastic signals:
- Overbought (>80): Suggests potential pullback, but can stay elevated in strong trends
- Oversold (<20): Suggests potential bounce, but can stay depressed in downtrends
- Crossover: When %K crosses above %D in oversold territory, it can signal a bullish reversal. When %K crosses below %D in overbought territory, it can signal a bearish reversal
Stochastic is particularly sensitive to price changes, making it useful for identifying short-term momentum shifts. However, this sensitivity can also generate more false signals in choppy markets.
Volatility gauges
Volatility indicators measure how much prices are fluctuating, helping you assess risk levels and identify potential breakout or reversal zones.
Bollinger Bands
Bollinger Bands consist of a middle band (typically a 20-period SMA) and two outer bands that represent standard deviations above and below the middle band. The bands expand and contract based on market volatility.
How Bollinger Bands work:
- Middle band: A simple moving average (usually 20 periods)
- Upper band: Middle band plus two standard deviations
- Lower band: Middle band minus two standard deviations
Bollinger Band signals:
- Band expansion: When bands widen, it indicates increased volatility, often preceding significant price moves
- Band contraction (squeeze): When bands narrow, it indicates low volatility and often precedes explosive moves in either direction
- Price touching upper band: Can signal overbought conditions, but in strong trends, price can "walk the band"
- Price touching lower band: Can signal oversold conditions, but in downtrends, price can stay near the lower band
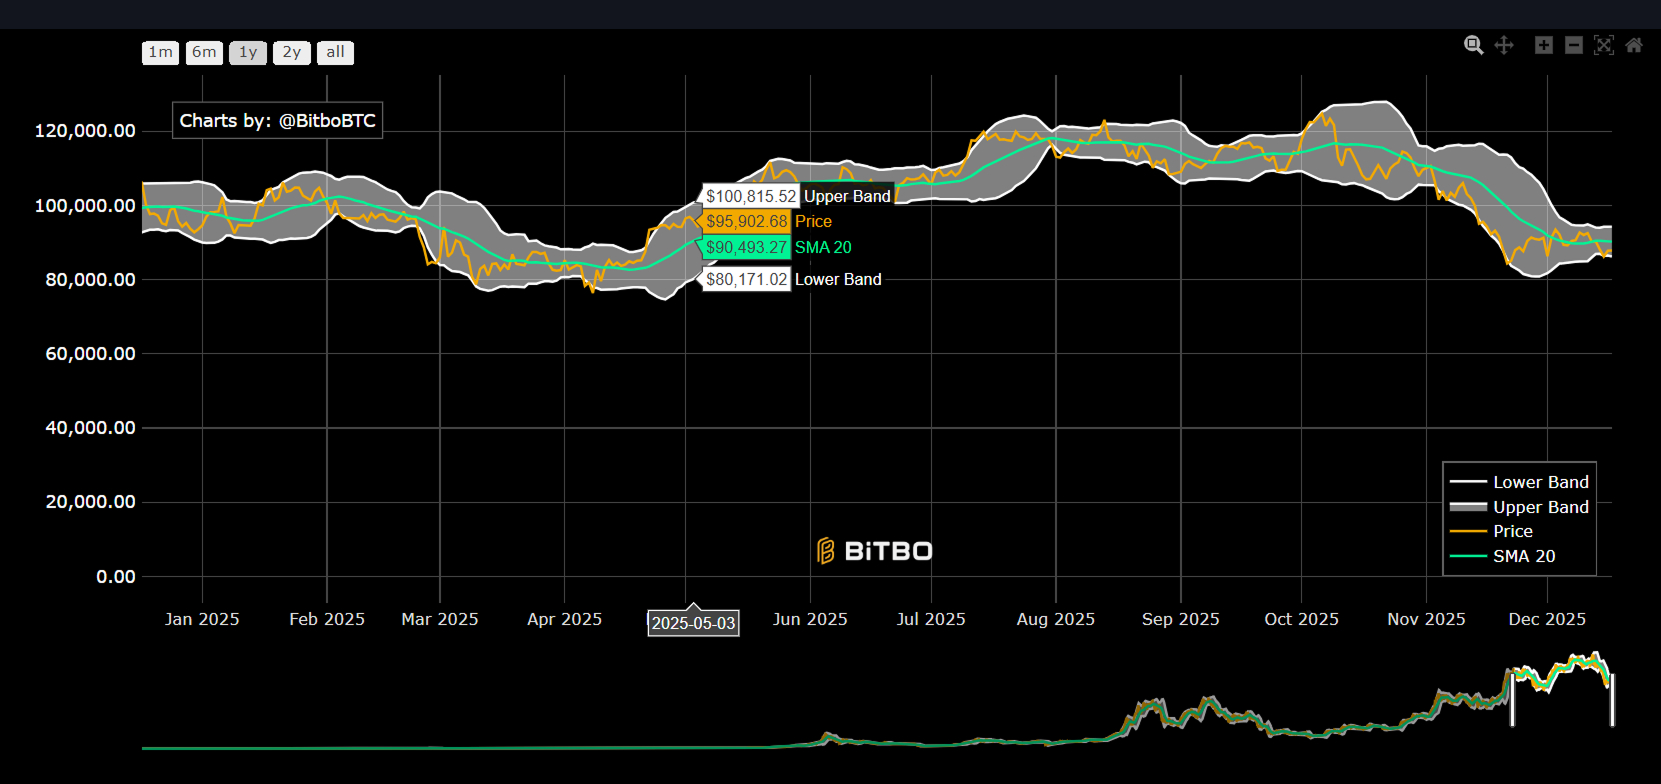
The "Bollinger Squeeze" is a particularly useful pattern. When bands contract to unusually tight levels, it suggests volatility compression that often resolves with a sharp move. Traders watch for breakouts from these squeeze patterns as potential entry signals.
Using Bollinger Bands with other indicators:
Bollinger Bands work well when combined with momentum indicators. If price touches the upper band while RSI is overbought, it strengthens the overbought signal. If price touches the lower band while RSI shows bullish divergence, it can signal a potential reversal.
Average True Range (ATR)
The Average True Range (ATR) measures market volatility by calculating the average of true ranges over a specified period. The true range is the greatest of: current high minus current low, absolute value of current high minus previous close, or absolute value of current low minus previous close.
How ATR works:
ATR doesn't indicate trend direction. It simply measures volatility, expressed in the same units as price (dollars for Bitcoin). Higher ATR values indicate more volatility; lower values indicate less volatility.
Using ATR:
- Stop-loss placement: Many traders set stop-losses at a multiple of ATR (e.g., 2x ATR) below entry price, adjusting for current volatility
- Position sizing: Higher ATR suggests larger price swings, which might warrant smaller position sizes
- Volatility regime detection: Rising ATR suggests increasing uncertainty; falling ATR suggests stability
- Breakout confirmation: Breakouts accompanied by rising ATR are often more reliable than breakouts with low ATR
ATR is particularly useful for risk management. It helps you set stop-losses that account for normal market volatility, reducing the likelihood of being stopped out by routine price fluctuations.
Volume and flow indicators
Volume indicators help confirm price movements by showing whether moves are supported by trading activity. Strong moves on high volume are typically more reliable than moves on low volume.
On-Balance Volume (OBV)
On-Balance Volume (OBV) is a cumulative indicator that adds volume on up days and subtracts volume on down days. The idea is that volume should confirm price direction: rising prices should be accompanied by rising OBV, and falling prices should be accompanied by falling OBV.
How OBV works:
- Up day: Add the day's volume to the OBV total
- Down day: Subtract the day's volume from the OBV total
- Unchanged: OBV remains the same
OBV signals:
- Rising OBV with rising price: Confirms uptrend, suggests accumulation
- Falling OBV with falling price: Confirms downtrend, suggests distribution
- Divergence: When price makes new highs but OBV makes lower highs (or vice versa), it can signal weakening trend and potential reversal
OBV helps identify whether "smart money" is accumulating or distributing. Rising OBV suggests institutional or large players are buying, while falling OBV suggests they're selling.
Accumulation/Distribution Line
The Accumulation/Distribution Line is similar to OBV but uses a different calculation. Instead of simply adding or subtracting volume, it multiplies volume by a "close location value" that measures where the close sits within the day's range.
How it works:
The close location value ranges from -1 (close at low) to +1 (close at high). This gives more weight to days where price closes near the high (accumulation) or low (distribution), providing a more nuanced view of volume flow.
Signals:
- Rising A/D Line: Suggests accumulation, buyers are in control
- Falling A/D Line: Suggests distribution, sellers are in control
- Divergence: When price and A/D Line diverge, it can signal potential reversals
MVRV Z-Score for Bitcoin
The MVRV (Market Value to Realized Value) Z-Score is a Bitcoin-specific indicator that compares market capitalization to realized capitalization. Realized cap values each coin at the price it last moved, providing a measure of the average cost basis of all Bitcoin holders.
How MVRV Z-Score works:
- Market cap: Current price × total supply
- Realized cap: Sum of (price when each coin last moved × number of coins)
- MVRV ratio: Market cap ÷ Realized cap
- Z-Score: Standardized measure of how far current MVRV is from its historical mean
MVRV Z-Score interpretation:
- Above 7: Historically associated with cycle tops and overheated markets. Values above 7 have often marked major Bitcoin peaks
- Between 3-7: Elevated but not extreme, suggests strong bull market conditions
- Between 0-3: Moderate valuation, typical of mid-cycle conditions
- Below 0: Undervalued territory, often seen during bear markets and accumulation phases
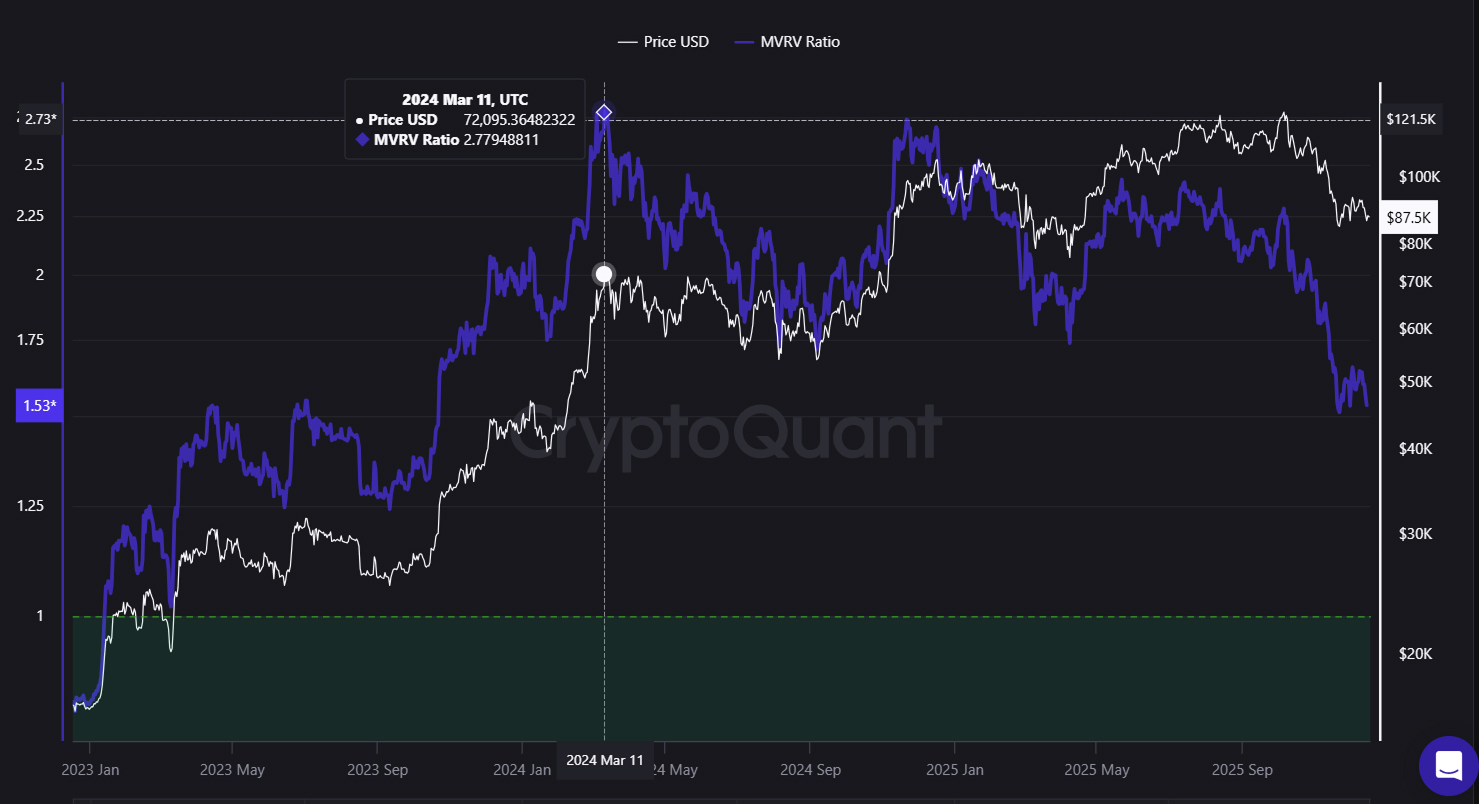
The MVRV Z-Score is particularly useful for cycle analysis because it provides a long-term valuation context. It helps identify when Bitcoin is trading at historically extreme levels relative to the average cost basis of holders, which often coincides with cycle tops and bottoms.
Why MVRV matters:
MVRV reflects market psychology. When MVRV is high, current holders have large unrealized gains, creating selling pressure. When MVRV is low, most holders are at a loss, reducing selling pressure and creating accumulation opportunities.
Short-term vs cycle indicators: when to use each
Understanding the difference between short-term and cycle indicators helps you choose the right tools for your timeframe and objectives.
Short-term (micro) indicators are designed for immediate market conditions. They help with:
- Day trading and swing trading
- Timing entries within a broader trend
- Identifying short-term overbought/oversold conditions
- Managing risk on individual trades
Examples include 14-period RSI, 50-day and 200-day moving averages, short-term volume patterns, and intraday momentum oscillators.
Cycle (meso/macro) indicators focus on longer-term market structure. They help with:
- Strategic positioning across multi-year cycles
- Identifying major accumulation and distribution phases
- Timing major exits at cycle tops
- Understanding where Bitcoin sits within its historical cycle
Examples include the 200-week moving average, MVRV Z-Score, halving cycle analysis, Pi Cycle Top Indicator, and Stock-to-Flow model.
Combining both layers
The most effective approach combines both layers. Use cycle indicators to understand the broader context: are we in a bull market, bear market, or accumulation phase? Then use short-term indicators to time entries and exits within that context.
For example, if cycle indicators suggest we're in a bull market (price above 200W MA, MVRV Z-Score between 3-7), you might use short-term RSI to identify pullback entries. If cycle indicators suggest we're near a cycle top (MVRV Z-Score above 7, Pi Cycle Top flashing), you might use short-term indicators to time exits rather than new entries.
This multi-timeframe approach helps you avoid the common mistake of using short-term indicators for cycle decisions, or cycle indicators for day trading. Each layer serves a different purpose, and understanding both gives you a more complete market view.
Self-fulfilling nature and pitfalls
Technical indicators can become self-fulfilling prophecies. When enough traders watch the same levels (like the 200-day moving average or RSI 70), those levels often act as support or resistance simply because traders react to them.
This isn't necessarily bad. If enough market participants respect a level, it becomes meaningful regardless of its theoretical validity. The 200-day moving average works as support partly because traders expect it to work.
However, this creates pitfalls:
Indicators fail in sideways markets
Most trend-following indicators (moving averages, MACD) work well in trending markets but generate false signals in choppy, sideways conditions. In consolidation phases, price can whipsaw around moving averages, creating multiple false breakouts.
Overbought doesn't mean "sell"
In strong uptrends, RSI can stay above 70 for extended periods. Selling every time RSI hits 70 would cause you to exit strong trends early. Overbought conditions in uptrends often resolve through time (consolidation) rather than sharp reversals.
Oversold doesn't mean "buy"
In downtrends, RSI can stay below 30 for extended periods. Buying every time RSI hits 30 in a downtrend would catch falling knives. Oversold conditions in downtrends can persist until the trend structure changes.
Divergence can be early
Divergence signals (when price and indicator move in opposite directions) can appear weeks or months before reversals occur. Acting on divergence too early can mean sitting through extended losses while waiting for the reversal.
Risk management is essential
No indicator is perfect. Even the best combinations will generate false signals. This is why risk management—position sizing, stop-losses, and not risking more than you can afford to lose—is more important than finding the "perfect" indicator.
Best-practice indicator combinations
Instead of relying on a single indicator, most traders combine multiple tools to build a more robust view. The key is pairing indicators that measure different things: trend, momentum, volatility, and volume.
A balanced short-term combination:
- Trend indicator: 50-day and 200-day moving averages to identify direction and potential crossovers
- Momentum indicator: 14-period RSI to identify overbought/oversold conditions and momentum strength
- Volume indicator: On-Balance Volume or Accumulation/Distribution Line to confirm price moves
This combination gives you trend direction (moving averages), momentum state (RSI), and volume confirmation (OBV/A-D Line). When all three align—price above moving averages, RSI showing healthy momentum (40-70 range), and volume confirming—you have a stronger signal than any single indicator alone.
A balanced cycle combination:
- Cycle positioning: 200-week moving average distance to understand where Bitcoin sits in its long-term cycle
- Valuation context: MVRV Z-Score to assess whether Bitcoin is overvalued or undervalued relative to holder cost basis
- Momentum confirmation: Weekly RSI to confirm whether cycle momentum is strengthening or weakening
This combination helps with strategic positioning: understanding cycle phase (200W MA), valuation extremes (MVRV), and momentum state (weekly RSI). When cycle indicators suggest accumulation (below 200W MA, low MVRV), and momentum is improving (weekly RSI rising from oversold), it can signal a favorable accumulation zone. For a detailed guide on using indicators specifically for market timing, see top Bitcoin indicators for market timing.
Programmatic access to indicators
For those building automated systems or integrating indicators into trading workflows, programmatic access to pre-calculated indicators can save time and reduce calculation errors. APIs that provide normalized, pre-interpreted indicator values allow you to focus on strategy rather than data processing.
HunchMachine's API provides access to many of these indicators in pre-processed format, including RSI 14 for short-term momentum, RSI 14 Trend for weekly momentum context, BTC 200W MA Distance for cycle positioning, and BTC Overview which combines price, momentum (RSI), volatility, and moving average signals in one snapshot.
For cycle analysis, endpoints like MVRV Z-Score, Halving Cycle, and Pi Cycle Top provide long-term context for strategic positioning.
These endpoints return not just raw values but also interpreted summaries and trend classifications, making it easier to integrate indicator logic into automations or feed context into AI reasoning systems without needing to manually calculate and interpret each metric.
So… which Bitcoin indicators are best?
There's no single "best" indicator. The answer depends on what you're trying to measure and your timeframe.
For trend identification, moving averages (especially the 200-week MA for cycle context) and MACD provide clear directional signals. For momentum assessment, RSI and Stochastic help identify overbought/oversold conditions and potential reversals. For volatility measurement, Bollinger Bands and ATR help assess risk and identify potential breakout zones. For volume confirmation, OBV and Accumulation/Distribution Line help validate price moves.
The most effective approach combines multiple indicators that measure different aspects: a trend indicator (moving averages), a momentum indicator (RSI), and a volume indicator (OBV or MVRV for cycle context). This balanced combination provides trend direction, momentum state, and volume confirmation—giving you a more complete market view than any single tool alone.
Understanding the difference between short-term and cycle indicators also matters. Short-term tools (14-period RSI, 50/200-day MAs) help with timing entries and exits. Cycle tools (200-week MA, MVRV Z-Score) help with strategic positioning across multi-year cycles. Using both layers—cycle context for strategy, short-term tools for timing—helps you avoid getting whipsawed by noise while missing larger structural shifts.
Remember that indicators are tools, not guarantees. They help you read market structure, but they fail in sideways markets, can stay overbought/oversold in strong trends, and require risk management regardless of signal quality. The best indicator combination is one you understand, that fits your timeframe, and that you use consistently with proper risk management.
The question "Which Bitcoin indicators are best?" stops being about finding a magic tool and becomes: "How do I combine multiple indicators to build a robust view of market structure, and how do I use that view to make better decisions while managing risk?"
Choose indicators that measure different things, understand their strengths and weaknesses, and combine them in ways that complement each other. No single indicator tells the full story, but together they provide a more complete picture of market dynamics.