When will the crypto cycle end?

When people ask "When will the crypto cycle end?", they're usually trying to answer a more practical question: how do I know when we're transitioning from euphoria to the next bear phase, and what should I do about it?
There's no calendar date you can circle. But crypto cycles follow patterns, and understanding those patterns, plus the signals that tend to appear near cycle transitions, gives you a framework to work with instead of pure guesswork.
This article breaks down:
- What the crypto cycle actually is and its typical phases
- What "ending a cycle" means in practical terms
- Which signals tend to flash when a cycle is nearing its end
- Where the current cycle appears to sit right now
- How to monitor cycle transitions dynamically rather than fixating on dates
The crypto cycle: four phases that repeat
The crypto cycle, and Bitcoin's cycle in particular, follows a recurring pattern tied to halving events that occur approximately every four years. Each cycle typically moves through four distinct phases:
1. Accumulation
After a bear market bottom, price consolidates at relatively low levels. Early adopters and long-term holders accumulate. Sentiment is cautious or fearful. This phase can last months or even over a year.
2. Growth/Expansion
Price begins trending upward more consistently. The halving reduces new supply, creating scarcity pressure. Adoption increases. Momentum builds. This is where most of the bull market gains happen.
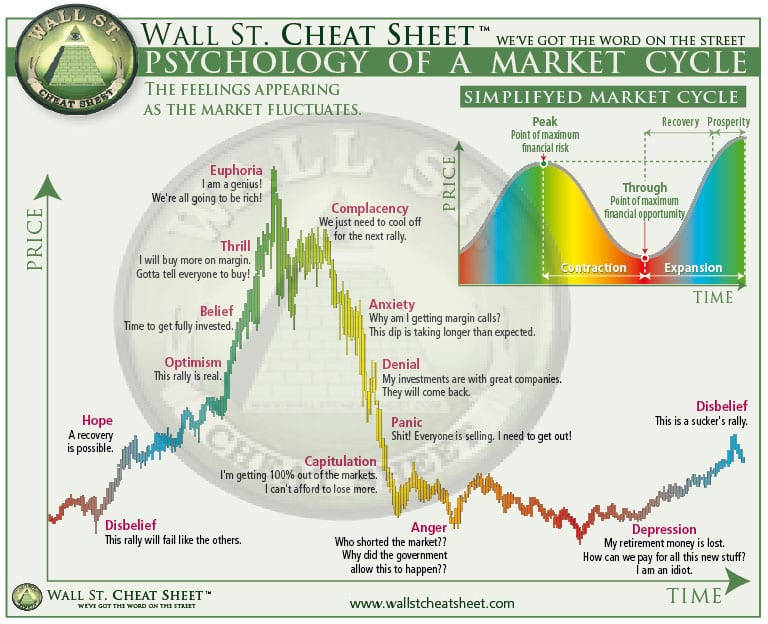
3. Euphoria/Peak
Price accelerates into parabolic moves. Media coverage peaks. New retail investors flood in. Extreme optimism dominates. This is where cycle tops typically form, often 12–18 months after the halving.
4. Crash/Drawdown
The euphoria exhausts itself. Price corrects sharply, often falling 70–85% from the peak. Sentiment shifts from greed to fear. The cycle completes and the next accumulation phase begins.
This four-phase structure has repeated across Bitcoin's major cycles: 2012–2013, 2016–2017, 2020–2021, and now the current cycle that began with the April 2024 halving.
Cycles aren't random. They're driven by the combination of supply shocks (halvings), adoption waves, liquidity conditions, and collective psychology. Understanding which phase you're in helps you set realistic expectations and adjust risk accordingly.
What "ending a cycle" actually means
When analysts talk about a cycle "ending," they're referring to the transition from phase 3 (euphoria/peak) to phase 4 (crash/drawdown).
This transition isn't a single moment. It's a process:
- Price reaches an extreme high (the cycle peak)
- Multiple indicators start flashing warning signals
- Sentiment shifts from euphoria to uncertainty, then fear
- Price begins correcting, first gradually, then more sharply
- The correction deepens into a full bear market drawdown
Historically, these drawdowns have been severe. After the 2013 peak, Bitcoin fell roughly 83% over the following year. After the 2017 peak, the drawdown was approximately 84%. After the 2021 peak, the decline reached about 77% before finding a bottom.
So "ending a cycle" means the euphoric phase has exhausted itself, and the market is transitioning into a prolonged correction phase that will eventually reset the cycle and create the next accumulation opportunity.
You don't need to catch the exact top. What matters is recognizing when the environment shifts from "healthy expansion" to "statistically dangerous" and adjusting your positioning accordingly.
Signals that suggest a cycle is nearing its end
Over multiple cycles, analysts have identified a set of indicators that tend to cluster near cycle tops. No single signal is perfect, but when several align, the probability of a cycle transition increases.
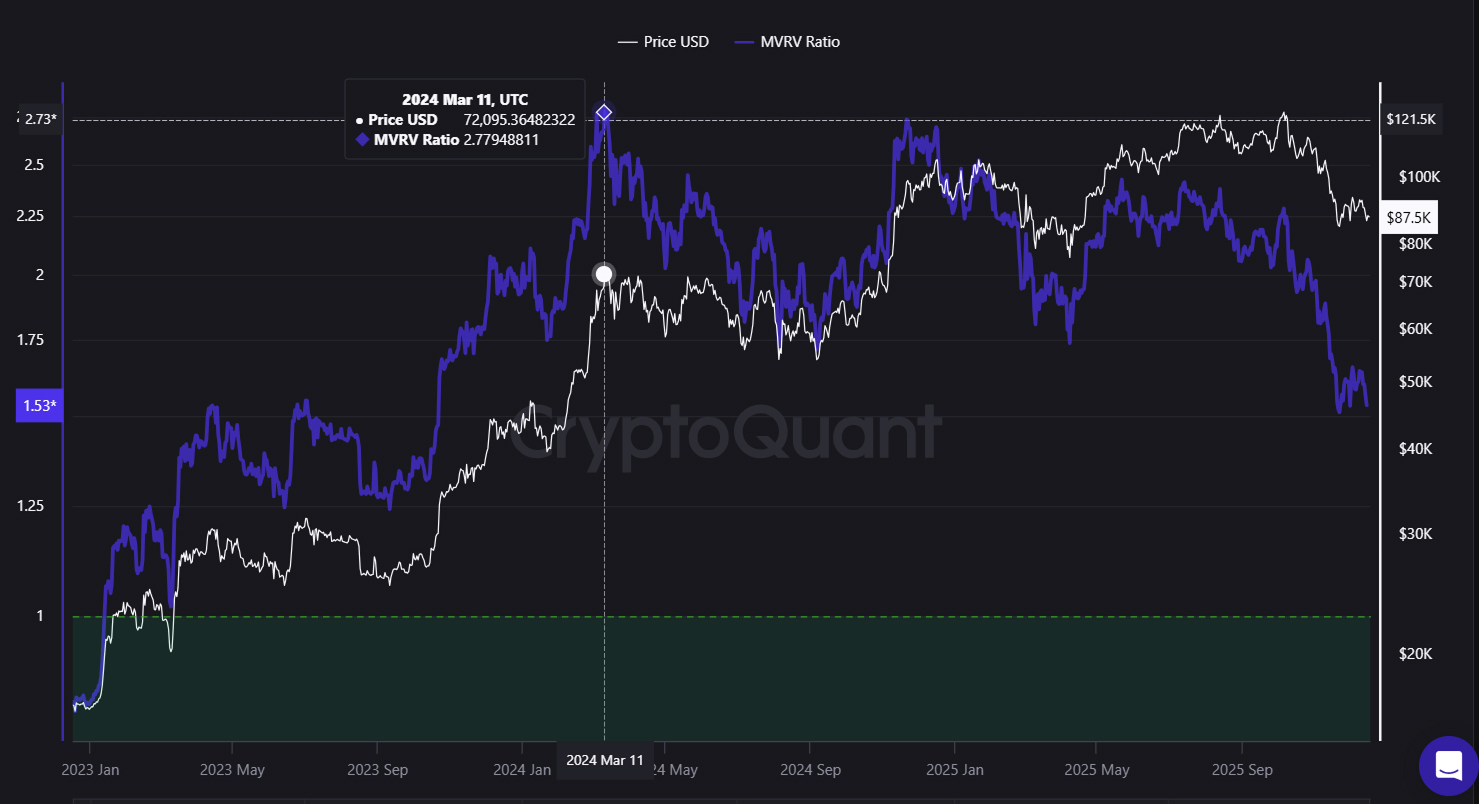
Extreme MVRV Z-Score
The MVRV Z-Score compares Bitcoin's market price to its realized value (what holders actually paid). When this metric spikes above ~7, it has historically coincided with cycle peaks. Values this high suggest the market is sitting on massive unrealized profits, creating pressure for profit-taking that can trigger reversals.
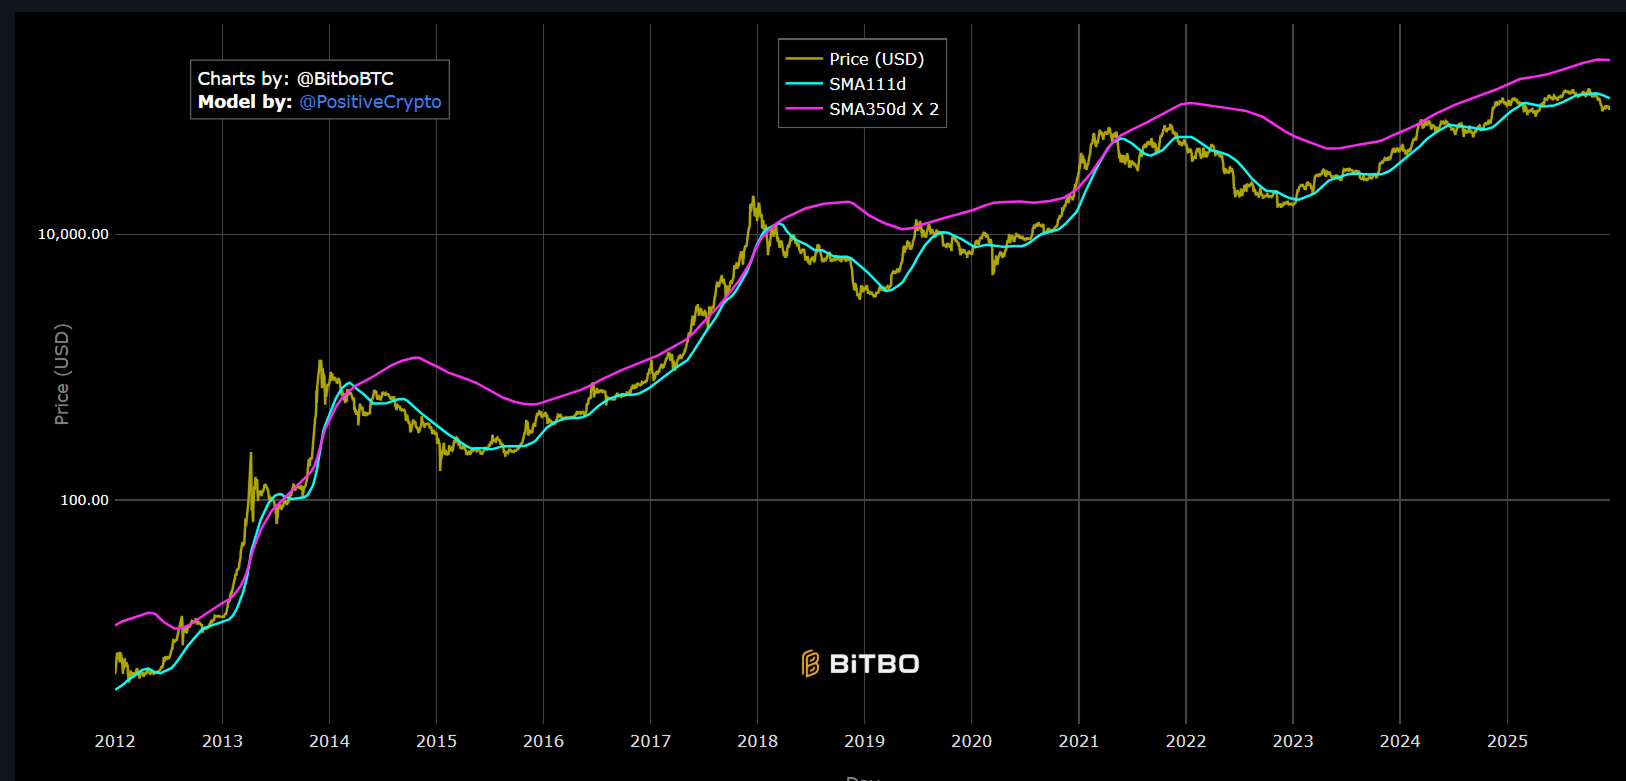
Pi Cycle Top cross
The Pi Cycle Top Indicator triggers when the 111-day moving average crosses above 2× the 350-day moving average. This signal has accurately flagged the tops of 2013, 2017, and 2021. It doesn't predict the bull run. Instead, it indicates when the move is already very advanced and entering dangerous territory.
Exchange reserve depletion
When Bitcoin reserves on exchanges drop significantly during a bull run, it often signals that coins are moving to long-term storage (bullish). But when reserves start rising again near cycle tops, it can indicate selling pressure building. Monitoring exchange flows provides real-time insight into holder behavior.
Extreme sentiment readings
The Crypto Fear & Greed Index combines volatility, volume, dominance, and social data. When readings hit extreme greed (values above 80), it often coincides with the final euphoric phase before corrections. The index isn't a timing tool, but extreme readings combined with other signals create a dangerous cocktail.
Valuation models in overheat zones
Models like the Rainbow Chart, Stock-to-Flow, AHR999 Index, and 2-Year MA Multiplier all have "overheat" or "top" zones. When multiple of these models converge in their upper ranges simultaneously, it suggests the market is trading in historically dangerous territory.
Derivatives showing extreme positioning
Funding rates going extremely positive (longs paying shorts heavily), open interest at elevated levels, and futures basis in extreme contango can all signal that leverage is stretched and the market is vulnerable to deleveraging events.
The pattern is clear. Isolated signals can be false alarms. But when several of these indicators align, like MVRV elevated, Pi Cycle triggered, sentiment extreme, and valuation models in overheat zones, the probability of a cycle transition increases significantly.
If you want to track these signals systematically, HunchMachine's Crypto Top & Bottom Detector automation monitors a basket of these indicators and provides a simple summary of how many top signals are currently active, helping you understand whether the environment is closer to healthy expansion or dangerous euphoria.
Current cycle context: where are we now?
As we approach the end of 2025, the current cycle is showing something unusual, and it's creating a lot of uncertainty.
The calendar says one thing:
- The most recent halving occurred in April 2024
- Historically, by this point in the cycle (roughly 18–20 months post-halving), Bitcoin would typically be entering or already in a bear market
- Past cycles have transitioned from euphoria to correction within this timeframe
But the indicators are saying something else:
- No euphoria phase occurred. There was no parabolic blow-off top, no extreme retail FOMO, no altseason explosion
- Top indicators haven't triggered. MVRV never reached extreme levels, Pi Cycle Top never crossed, sentiment never hit the extreme greed readings that typically mark cycle peaks
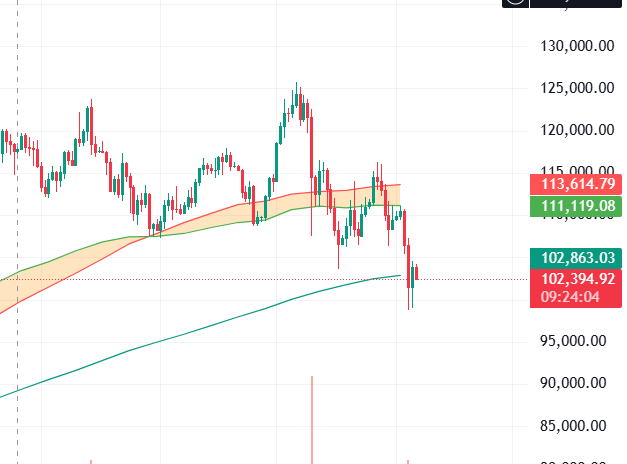
- Price structure is weak but not broken. Bitcoin has been trading below the 50-week moving average for several weeks, but it's hovering near that level rather than crashing through it decisively
This creates a confusing picture. On one hand, the market is showing weakness: price below key moving averages, lack of momentum, defensive positioning. On the other hand, the classic cycle-ending signals like euphoria, extreme valuations, and top indicator clusters never appeared.
Some analysts argue this could be a local reset rather than a full cycle end, meaning a correction within an ongoing bull market that extends beyond historical averages. Others see it as an early bear market that's playing out differently than previous cycles, perhaps due to institutional flows and ETF dynamics creating a more gradual transition.
We're in an uncertain phase with mixed signals. The market looks bearish from a structure standpoint, but it hasn't shown the exhaustion patterns that typically mark cycle tops.
When signals are mixed and the cycle context is unclear, the best approach is often risk-management mode rather than trying to predict exactly what happens next. This means:
- Taking small profits on bounces rather than holding for perfect tops
- Keeping cash ready in case of further weakness
- Staying exposed but lighter, maintaining some position but not maximum exposure
- Waiting for clearer signals before making big moves
You don't need perfect timing. What you need is a clear rule for when to switch from "protect" to "attack" and stick to it. For many, that rule might be: wait for a clean reclaim of the bull market support band (20W EMA / 21W SMA) before sizing up again, or wait for a real panic flush where leverage gets wiped out before deploying capital.
Following accounts like @InvestWithGPT can be useful here. They provide regular cycle context and market structure analysis that helps you navigate these uncertain phases with a rational framework rather than reacting to every price move. Even in uncertainty, there's always a sensible approach: protect capital, wait for clarity, and only commit when the market proves it's healthy.
So… when will the crypto cycle end?
Based on historical patterns, the current cycle could transition from expansion to correction somewhere between late 2025 and mid-2026, but that's a probabilistic estimate, not a promise. Past cycles have typically lasted somewhere between 1,000 and 1,500 days from low to peak to low, with the full cycle duration clustering around the four-year mark.
More importantly, fixating on a calendar date is less useful than building a system to monitor cycle transitions in real time.
What makes sense is:
- Track the cycle calendar to understand where you are relative to the halving (days post-halving, typical phase durations)
- Monitor top indicators like MVRV, Pi Cycle, Rainbow Chart, sentiment, and derivatives positioning
- Read macro context to understand how liquidity conditions, Fed policy, and institutional flows are affecting the cycle
- Adjust positioning dynamically by reducing exposure as top signals accumulate, rather than waiting for a specific date
Tools like HunchMachine's cycle indicators API and the Crypto Top & Bottom Detector automation help turn this approach into a repeatable workflow. Instead of depending on X alerts or trying to guess dates, you can build a system that tracks cycle positioning and top signals for you, warning you when the environment starts looking too much like previous cycle tops.
The question "When will the crypto cycle end?" stops being about finding a magic date and becomes: "How do I recognize when we're transitioning from healthy expansion to dangerous euphoria, and what should I do about it?"
Monitor the signals, respect the probabilities, and adjust your positioning as the evidence accumulates. Cycles don't end on schedule. They end when the conditions that drive them exhaust themselves. Your job is to recognize those conditions as they form, not to predict them months in advance.