When is the next Bitcoin cycle top?

When people ask "When is the next Bitcoin cycle top?", what they're really trying to understand is something else: where we are in the cycle right now and how long it makes sense to stay exposed before asymmetric risk stops being worth it.
There's no magic date, but it's not pure "feeling" either.
Bitcoin moves in multi-year cycles that are quite clear, driven by halvings, supply/demand dynamics, and collective investor psychology. If you understand how these cycles worked in the past — and which indicators tend to flash red near the top — you can stop relying on guesses and start working with informed probabilities.
In this article we'll follow three practical steps:
- Quickly understand how Bitcoin cycles work and why tops matter.
- Review the main cycle top indicators used by serious analysts.
- Combine historical timing + indicators + macro context to frame the next probable top window.
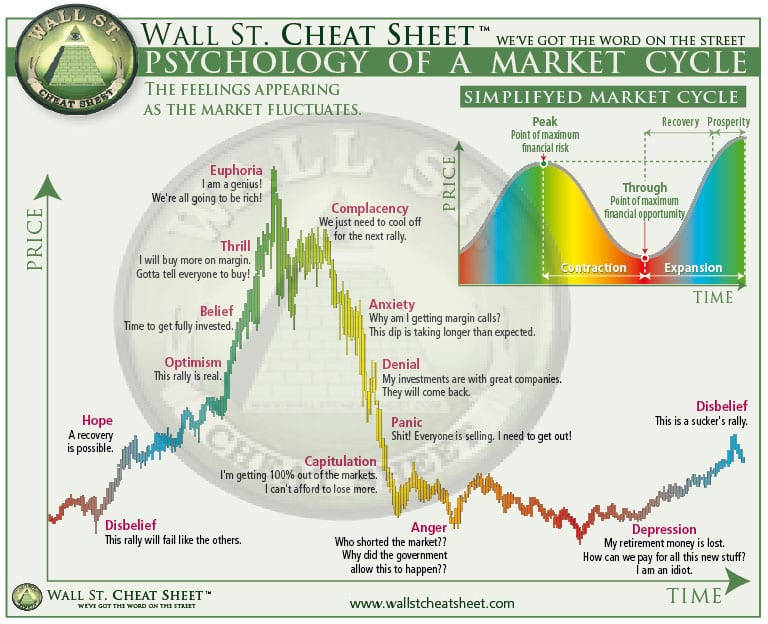
Bitcoin moves in cycles — and tops matter more than they seem
Historically, Bitcoin has followed fairly clear cycles around halvings (emission reductions every ~4 years): 2012, 2016, 2020, and 2024. In each cycle we've seen a similar pattern:
- A accumulation phase post-bear market
- An expansion phase where price accelerates as new supply drops
- A euphoria phase and, finally, a cycle top followed by deep correction
The previous peaks were:
- Late 2013 (after the 2012 halving)
- December 2017 (after the 2016 halving)
- A distributed top zone between April and November 2021 (after the 2020 halving)
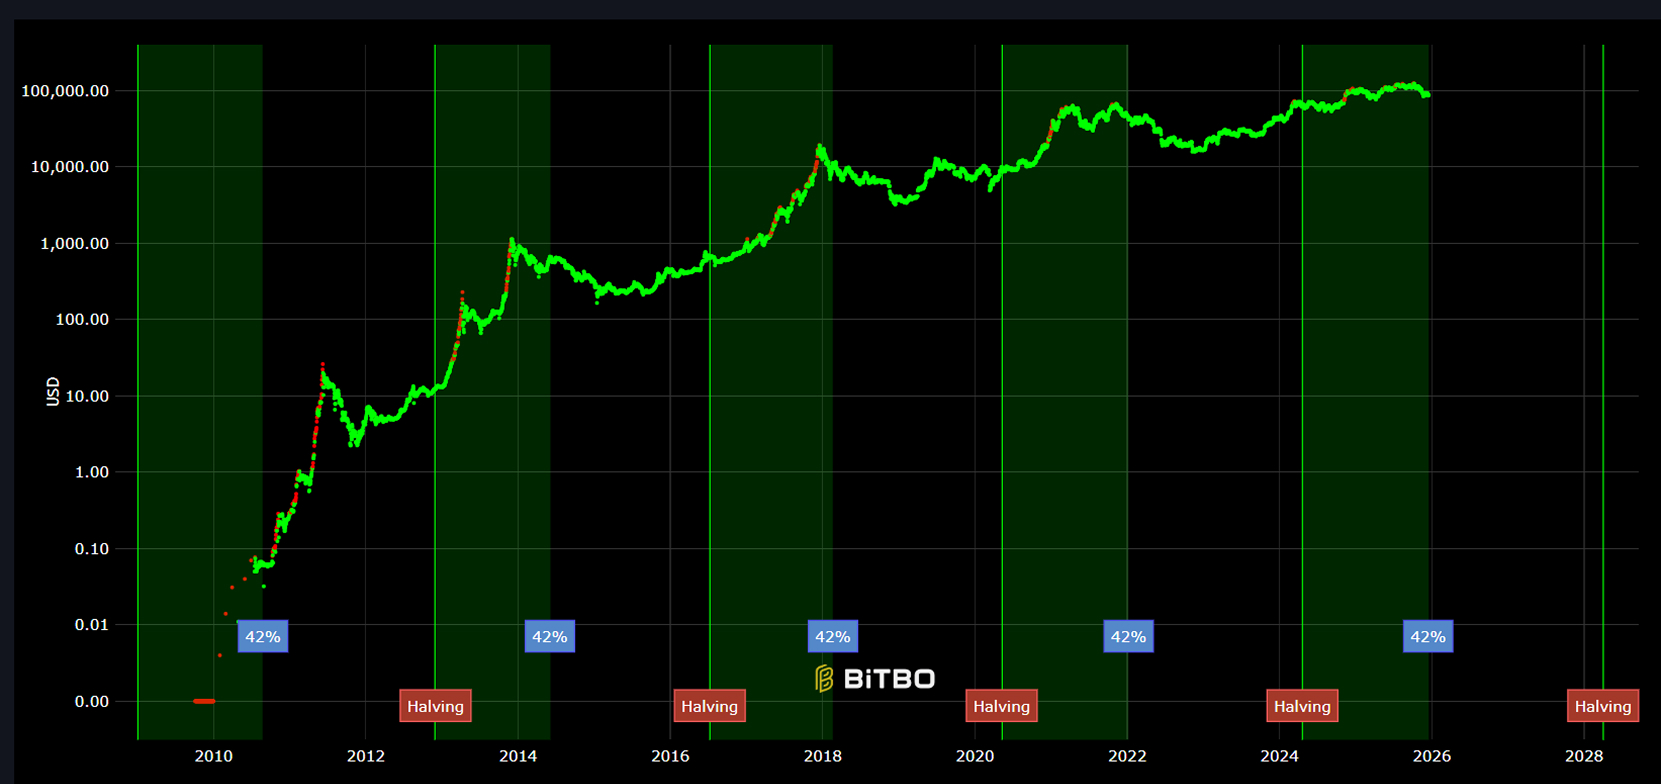
So it's not a perfect clock, but there's a structure: major bull markets tend to culminate some time after each halving, as the combination of narrative, liquidity, and scarcity hits the limit.
Understanding when a top might be forming isn't about hitting the exact dollar.
It's about:
- Avoiding being maximally exposed when the probability of negative asymmetry spikes
- Knowing how to distinguish normal bull market corrections from cycle exhaustion signals
- Adjusting investment horizons and risk more rationally
Hence the focus on cycle top indicators — they're not oracles, but they help you understand when the environment stops being healthy and starts getting statistically dangerous.
The main cycle top indicators that analysts follow
Over the last cycles, the on-chain and quantitative analysis community has refined a set of models that tend to concentrate signals in the top zone.
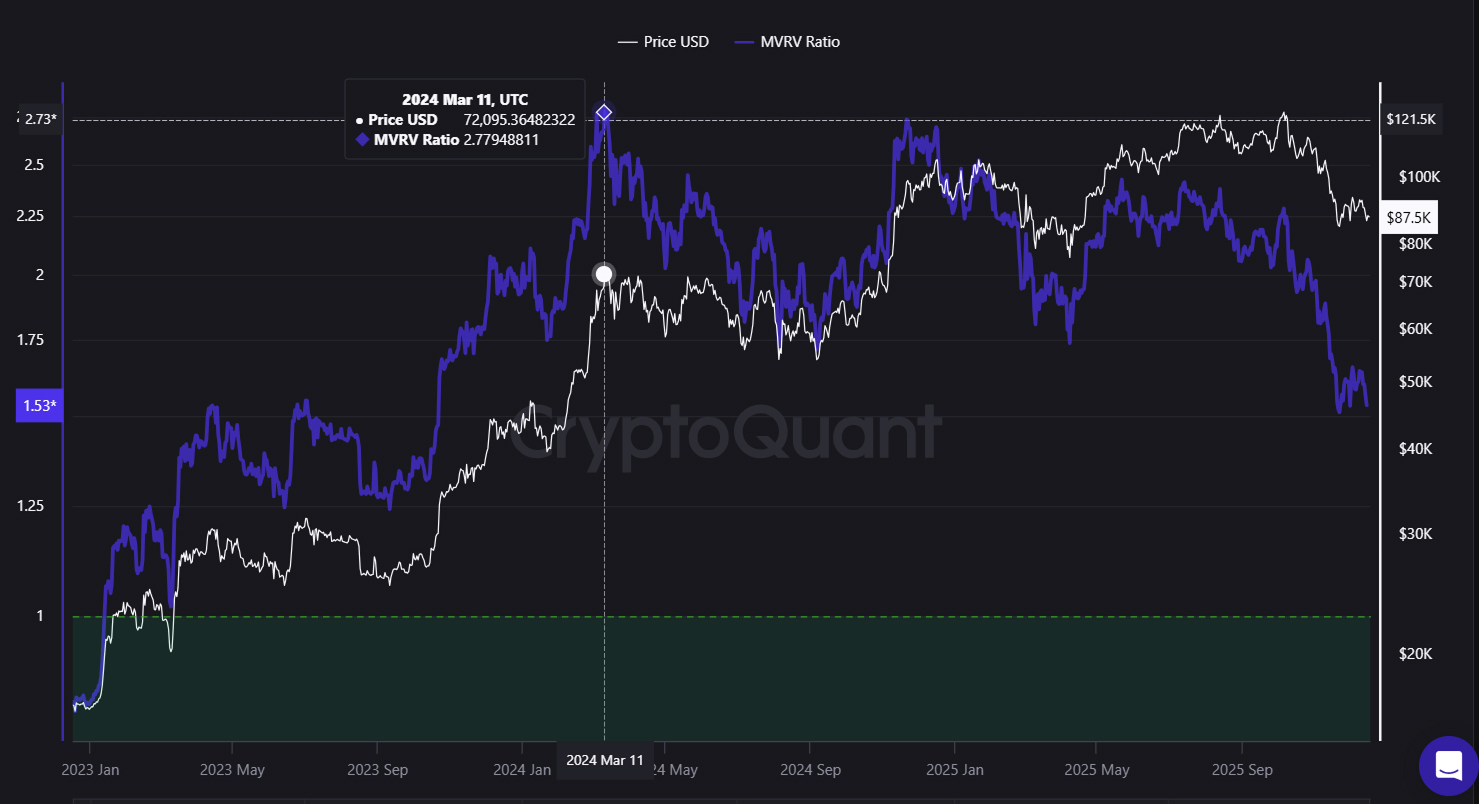
MVRV Z-Score: when the market stretches too far
The MVRV Z-Score compares Bitcoin's market price with its realized value (how much was actually paid for the coins in circulation). When this metric spikes to very high values — traditionally above ~7 — it has coincided with bull market euphoria peaks across multiple cycles.
In simple terms:
- "Low" values → market is near the average cost of holders → historical accumulation zones
- Extreme values → much of the market is sitting on unrealized profits → potential realization pressure
It's not an instant top trigger, but when MVRV enters historically red zone, the margin for further expansion becomes smaller and reversal risk more asymmetric.
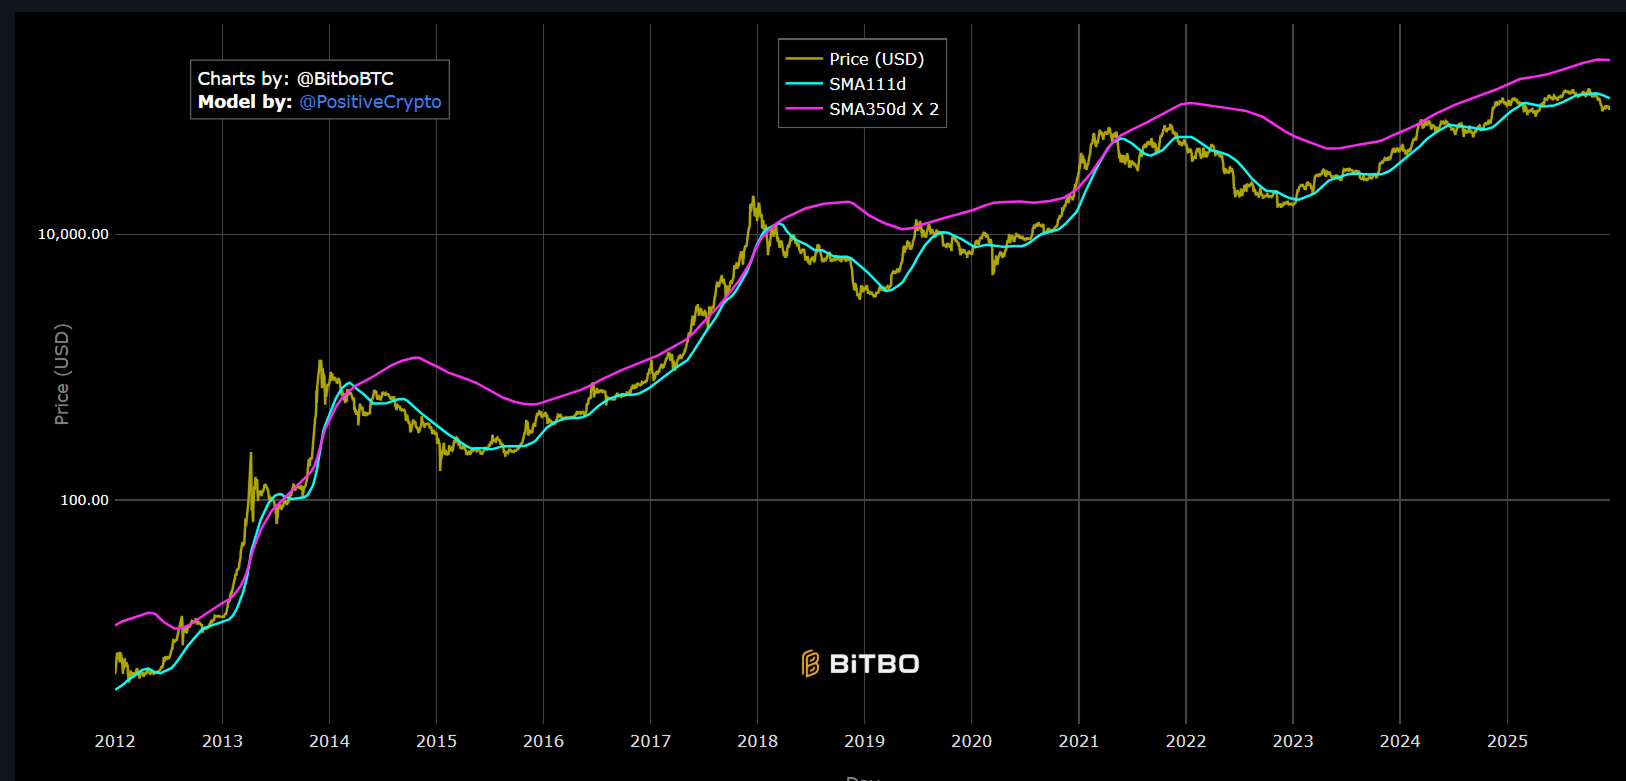
Pi Cycle Top: the moving average crossover that gets it right too often
The Pi Cycle Top Indicator became known for signaling with great accuracy the tops of 2013, 2017, and 2021.
The model looks at the crossover between:
- The 111-day moving average (MA111)
- And 2× the 350-day moving average (MA350)
When MA111 crosses above 2×MA350, the model fires a potential cycle top signal.
Key points:
- It doesn't "predict" the bull market — it only indicates when the move is already very advanced
- It has historically been a good "we're already in dangerous zone" signal, not an "exact buy/sell" signal
If you want to track this type of logic automatically, HunchMachine includes a Pi Cycle Top endpoint in its cycle indicators API, and uses this signal as part of the logic in the free Crypto Top & Bottom Detector automation.
Top Cap, Delta Top, and Terminal Price: layers of on-chain valuation
Over the years, several on-chain models have emerged trying to answer the same question: "how stretched is price relative to the network's history?".
Among the most used are:
- Top Cap – adjusts market capitalization to highlight extreme euphoria phases
- Delta Top – blends market cap with realized cap to find levels where the market historically "saturates"
- Terminal Price – another derived model that has coincided with exhaustion zones in bull markets
These models have been discussed in detail in various on-chain and cycle analyses and in on-chain analyst research.
The important thing here isn't memorizing formulas, but understanding the pattern:
Whenever several of these models converge in the same price zone, the probability that we're near a cycle top increases.
Sentiment: Fear and Greed and other psychology thermometers
Finally, there's the sentiment layer. The Crypto Fear & Greed Index is probably the best known — it combines volatility, volumes, dominance, and social data to produce a metric between "extreme fear" and "extreme greed".
Historically:
- Extreme fear tends to appear near capitulatory bottoms
- Extreme greed accompanies the last parabolic legs of bull markets
In isolation, it doesn't serve to "guess" the perfect tick of the top.
But when you have:
- MVRV in elevated zone
- Models like Pi Cycle / Top Cap / Delta Top in risk area
- And sentiment in "extreme greed"
…the context starts looking dangerously like the blow-off tops of previous cycles.
At HunchMachine, this sentiment layer enters, for example, through the Fear & Greed Index Trend indicator (included in the API) and is also used in the Crypto Top & Bottom Detector automation to classify whether the environment is closer to euphoria or capitulation.
The "typical timing" of tops: what history shows
Looking only at time vs. halvings, data from previous cycles suggests that:
- Bull markets tend to peak around 12–18 months after each halving
- In calendar terms, this has corresponded to something between ~1,000 and ~1,100 days after each halving, depending on the cycle and macro context. The full cycle length from low to peak to low typically spans roughly 1,000 to 1,500 days, with most clustering around the four-year mark
For reference, various cycle studies point to this temporal window as the "probable zone" of bull market maturation, not as a fixed date.
Applying this to the current cycle:
- The most recent halving occurred in April 2024
- If history rhymes, the "natural" window for a cycle top would be somewhere between late 2025 and mid-2026
Several analysts working with stock-to-flow models, logarithmic regressions, and advanced on-chain have put forward wide price ranges for that phase — for example, bands between $150k and $300k+ USD appear frequently in cycle analysis research.
The important point isn't fixing on a number, but understanding:
- We are, in calendar terms, walking toward the hottest part of the cycle
- As we approach that window, it's worth taking more seriously the signals from top indicators
How macro and institutional factors can extend or compress the top
Bitcoin's old cycles were dominated by:
- Retail adoption
- Lower institutional liquidity
- Much less integration with the traditional financial system
Today the context is different:
- Spot Bitcoin ETFs capture institutional capital flows that previously had no easy access route
- Funds, corporate treasuries, and professional managers become a relevant part of the holder base
- The market is much more sensitive to global liquidity, interest rates, and monetary policy
This means that:
- A scenario of abundant liquidity and rate cuts can extend the bull market beyond historical average
- An environment of aggressive monetary tightening or macro shocks can truncate the cycle earlier
Macro analysis research explores precisely this interaction between Bitcoin's internal cycle and macro context (yields, dollar, liquidity, etc.).
In practice, this reinforces the central idea:
The cycle model gives you the "temporal skeleton". Top indicators and macro context tell you if that skeleton is being respected or distorted.
Where HunchMachine fits into all this (practically and discreetly)
If you want to track these signals manually, you can:
- View MVRV, Pi Cycle, and other model charts on public sites
- Read technical articles and threads on X whenever there are updates
- Try to put it all together in a notebook or spreadsheet
It works, but it doesn't scale.
What HunchMachine does is take those cycle, trend, sentiment, and leverage indicators and deliver them already:
- In structured JSON (via API)
- With trends, zones, and natural language summaries
- Ready to be used in reports, n8n automations, or AI agents
On the automation side, the Crypto Top & Bottom Detector does precisely this:
- Checks the market regime (bull vs bear) based on long-term moving average structure
- Reads a set of cycle top and bottom indicators (Pi Cycle, 2Y MA Multiplier, AHR999, Golden Ratio, Stock-to-Flow, Fear & Greed, funding, basis, open interest, etc.)
- Returns a simple summary like:
"Bull market in progress — 0 top indicators active. Risk: low. Current corrections fit a bull market accumulation scenario."
This transforms the question "when is the next top?" into something more usable day-to-day:
- "Are we closer today to a healthy expansion scenario, or to a typical top context?"
If you prefer to follow this in a lighter format, the @InvestWithGPT account on X shows, in practice, how this data can be used to generate cycle notes and market context in natural language, published regularly without having to write everything by hand.
So… when will the next Bitcoin cycle top be?
Based on cycle history, top models, and post-halving timing, a reasonable estimate — not a promise — is:
- A probable top window somewhere between late 2025 and mid-2026,
- With the caveat that macro shocks, liquidity, and institutional behavior can shift this interval.
What makes more sense isn't fixing on a date, but setting up a system to:
- Track the cycle calendar (days post-halving)
- Monitor top indicators like MVRV, Pi Cycle, Rainbow, Stock-to-Flow, AHR999, 2Y MA Multiplier, etc.
- Incorporate sentiment and derivatives (Fear & Greed, funding, basis, open interest)
- Link it all to a practical reading: are we closer to accumulation, expansion, or distribution?
Tools like HunchMachine's cycle indicators API and no-code automations in n8n help turn this approach into a repeatable flow: instead of depending on X alerts or "feels", you have a system that tracks the cycle for you and warns you when the environment starts looking too much like the tops of the past.
In the end, the question "When is the next Bitcoin cycle top?" stops being a request for absolute prediction and becomes what really matters:
"How do I position myself intelligently as top signals begin — or don't — to appear?"