What Bitcoin indicators should I use?

When people ask "What Bitcoin indicators should I use?", they're usually trying to figure out which tools will help them make better decisions without getting overwhelmed by too many signals or conflicting information.
The answer depends on your objective. Are you trying to follow trends, time swing trades, or accumulate Bitcoin for the long term? Each goal requires different indicators and different timeframes. Understanding your objective first helps you choose the right tools instead of collecting every indicator available. If you're still exploring which Bitcoin indicators are best for different purposes, that article provides a comprehensive overview of indicator categories and their strengths.
This article helps you:
- Clarify your goal and match indicators to your trading style
- Understand indicator categories and what each measures
- See practical setups for different objectives
- Avoid common mistakes like indicator overload
- Simplify your approach with curated indicator suites
A simpler way to follow indicators
Before diving into specific indicators, there's a simpler approach if you're new to technical analysis or don't want to track multiple charts yourself.
The @InvestWithGPT account on X monitors Bitcoin indicators automatically and publishes easy-to-follow insights. It tracks trend indicators, momentum oscillators, cycle positioning, and market structure, then synthesizes them into clear updates about where Bitcoin sits in its cycle and what the current indicators suggest.
This approach gives you indicator-based insights without needing to learn how to read RSI, calculate moving averages, or interpret MVRV Z-Scores yourself. The account processes the technical data and presents it in plain language, helping you understand market structure without getting lost in indicator calculations.
If you prefer to build your own system or want to understand how indicators work, the rest of this article covers practical setups for different objectives.
Clarify your goal first
The indicators you should use depend on what you're trying to accomplish. Different objectives require different tools and different timeframes.
Trend following means identifying when Bitcoin is in an uptrend and staying positioned until the trend changes. This style works well with trend indicators like moving averages and MACD, focusing on weekly or monthly timeframes to avoid getting whipsawed by short-term noise.
Swing trading means capturing moves that last days to weeks, entering on pullbacks and exiting on rallies. This style benefits from momentum indicators like RSI combined with volatility tools like Bollinger Bands, using daily timeframes to time entries and exits.
Long-term accumulation means building a position over months or years, focusing on cycle bottoms and major accumulation zones. This style works best with cycle indicators like the 200-week moving average, MVRV Z-Score, and halving cycle analysis, using monthly or quarterly timeframes to identify major opportunities.
Understanding your objective helps you filter out irrelevant indicators. If you're accumulating for the long term, short-term RSI readings matter less than cycle positioning. If you're swing trading, cycle indicators provide context but won't help you time individual entries.
Indicator categories and their purpose
Indicators fall into four main categories, each measuring something different about market behavior. Understanding what each category does helps you choose the right tools for your objective.
Trend indicators
Trend indicators smooth out price data to reveal the underlying direction. They help answer: "Is Bitcoin trending up, down, or moving sideways?"
Moving Averages calculate the average price over a set period, creating a smoothed line that shows trend direction. When price is above the moving average, it suggests an uptrend. When price is below, it suggests a downtrend. Crossovers between shorter and longer moving averages (like 50-day crossing above 200-day) often signal trend changes.
MACD (Moving Average Convergence Divergence) shows the relationship between two exponential moving averages. It generates signals when the MACD line crosses above or below the signal line, indicating momentum shifts within a trend. MACD also shows divergence—when price makes new highs but MACD makes lower highs—which can signal weakening trends.
Purpose: Trend indicators help you stay on the right side of the market. They're most useful in trending conditions and can generate false signals in choppy, sideways markets.
Momentum indicators
Momentum indicators measure the speed and strength of price movements. They help answer: "Is the current move sustainable, or is it running out of steam?"
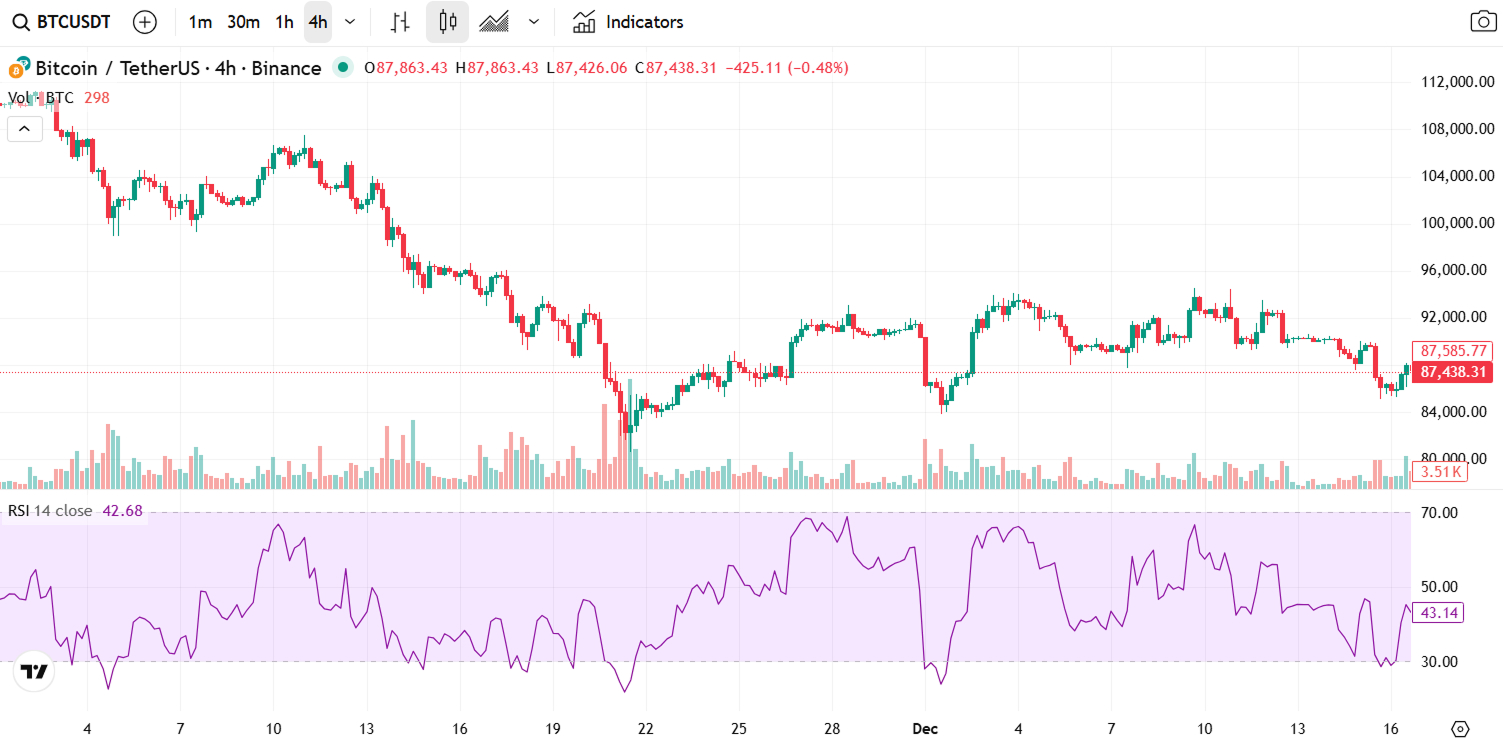
RSI (Relative Strength Index) compares recent gains to recent losses, creating a score from 0 to 100. Readings above 70 suggest overbought conditions (potential pullback), while readings below 30 suggest oversold conditions (potential bounce). However, in strong trends, RSI can stay overbought or oversold for extended periods.
Stochastic Oscillator compares the current closing price to the price range over a set period. Like RSI, it identifies overbought (>80) and oversold (<20) conditions, but it's more sensitive to price changes, making it useful for catching short-term momentum shifts.
Purpose: Momentum indicators help you identify potential reversal zones and gauge whether current moves are sustainable. They work best when combined with trend indicators to avoid false signals in strong trends.
Volatility indicators
Volatility indicators measure how much prices are fluctuating. They help answer: "How much risk am I taking, and where might breakouts occur?"
Bollinger Bands consist of a middle band (moving average) and two outer bands representing standard deviations. When bands expand, volatility is increasing. When bands contract (a "squeeze"), volatility is low and often precedes explosive moves. Price touching the upper or lower band can signal overbought or oversold conditions.
ATR (Average True Range) measures volatility by calculating the average of true ranges over a period. It doesn't indicate direction, just how much prices are moving. Higher ATR means more volatility and larger potential price swings.
Purpose: Volatility indicators help you assess risk and identify potential breakout zones. They're useful for setting stop-losses (using ATR) and recognizing when low volatility might resolve with a sharp move (Bollinger Squeeze).
Volume and flow indicators
Volume indicators show whether price moves are supported by trading activity. They help answer: "Is this move real, or just noise?"
On-Balance Volume (OBV) adds volume on up days and subtracts volume on down days, creating a cumulative line. Rising OBV with rising price confirms an uptrend. Falling OBV with falling price confirms a downtrend. Divergence between price and OBV can signal potential reversals.
Volume Profile shows where most trading activity occurred at different price levels, revealing support and resistance zones based on actual trading volume rather than just price action.
On-chain indicators for Bitcoin include metrics like MVRV Z-Score and Pi Cycle Top, which analyze blockchain data to assess market structure. MVRV compares market cap to realized cap (average cost basis), helping identify when Bitcoin is overvalued or undervalued relative to holder cost basis. Pi Cycle Top uses moving averages to identify potential cycle tops.
Purpose: Volume and flow indicators help confirm price moves and identify when "smart money" is accumulating or distributing. They're particularly useful for distinguishing real moves from false breakouts.
Practical setups for different objectives
Here are specific indicator combinations that work well for different trading styles and objectives.
For position traders: cycle turns and trend confirmation
Position traders hold positions for weeks to months, focusing on major trend changes and cycle positioning. A practical setup combines:
50/200-day moving average crossovers to identify trend changes. When the 50-day crosses above the 200-day (golden cross), it often signals the start of an uptrend. When it crosses below (death cross), it often signals a downtrend. These crossovers work best on weekly or monthly timeframes to filter out noise.
MVRV Z-Score to assess cycle positioning. When MVRV Z-Score is below 0, Bitcoin is typically undervalued relative to holder cost basis, suggesting accumulation opportunities. When it's above 7, Bitcoin is historically overvalued, suggesting potential cycle tops. Combining MVRV with moving average crossovers helps you identify cycle turns: a golden cross when MVRV is low suggests the start of a new cycle, while a death cross when MVRV is high suggests a cycle top.
How to use it: Wait for the 50/200-day crossover to signal a trend change, then check MVRV to understand cycle context. A golden cross with low MVRV suggests a favorable entry. A death cross with high MVRV suggests it's time to reduce exposure.
For swing traders: timing entries and exits
Swing traders capture moves that last days to weeks, entering on pullbacks and exiting on rallies. A practical setup combines:
RSI to identify overbought/oversold conditions. In an uptrend, RSI pullbacks to 40-50 often provide entry opportunities. In a downtrend, RSI bounces to 50-60 often provide exit opportunities. Avoid selling just because RSI hits 70 in a strong uptrend—it can stay elevated for extended periods.
Bollinger Bands to time entries and identify volatility conditions. When price touches the lower band in an uptrend, it often signals a pullback entry. When bands contract (squeeze), it suggests low volatility that might resolve with a sharp move. Entering after a squeeze breakout can catch explosive moves.
How to use it: In an uptrend, wait for RSI to pull back to 40-50 and price to touch the lower Bollinger Band, then enter. In a downtrend or when RSI is overbought (>70) and price touches the upper band, consider taking profits. Use Bollinger Squeezes to identify potential breakout zones.
For cycle investors: long-term accumulation and exits
Cycle investors focus on multi-year cycles, accumulating during bear markets and taking profits near cycle tops. A practical setup combines:
Pi Cycle Top Indicator uses the 111-day and 350-day moving averages to identify potential cycle tops. When the 111-day crosses above the 350-day by a significant margin, it has historically signaled cycle peaks. This indicator is particularly useful for timing major exits.
Puell Multiple compares daily miner revenue to the 365-day moving average. When Puell Multiple is high (>4), miner revenue is elevated relative to the average, often coinciding with cycle tops as miners sell to lock in profits. When it's low (<0.5), miner revenue is depressed, often coinciding with cycle bottoms as miners reduce selling pressure.
Macro sentiment data like the Crypto Fear & Greed Index provides context for cycle positioning. Extreme fear often marks cycle bottoms, while extreme greed often marks cycle tops. Combining on-chain indicators (Pi Cycle, Puell Multiple) with sentiment data helps confirm cycle phases.
How to use it: During accumulation phases (low Puell Multiple, extreme fear, price below 200-week MA), focus on building positions. When cycle indicators align (Pi Cycle Top flashing, high Puell Multiple, extreme greed, high MVRV), consider taking profits. The goal isn't to time the exact top, but to exit during the top 10-20% of the cycle.
Common mistakes to avoid
Many traders make the same mistakes when using indicators. Understanding these pitfalls helps you avoid them.
Indicator overload
Using too many indicators is one of the most common mistakes. Having 10 different indicators on your chart doesn't make your analysis better—it often creates confusion and conflicting signals.
The problem: When you use multiple indicators that measure the same thing (like RSI and Stochastic, both momentum oscillators), you're not getting additional information. You're just seeing the same signal in different formats, which can create analysis paralysis.
The solution: Choose 2-3 indicators that measure different things. For example, combine a trend indicator (moving averages), a momentum indicator (RSI), and a volume indicator (OBV). This gives you trend direction, momentum state, and volume confirmation without redundancy.
Using short-term indicators for long-term decisions
Another common mistake is using daily RSI or 50-day moving averages to make cycle decisions. Short-term indicators are designed for short-term timeframes.
The problem: A daily RSI reading might show overbought conditions while weekly or monthly indicators suggest the bull market is still early. Acting on the daily signal could cause you to exit a strong trend prematurely.
The solution: Match indicator timeframes to your objective. For cycle investing, use weekly or monthly indicators. For swing trading, use daily indicators. For day trading, use hourly or 15-minute indicators. Understanding which Bitcoin indicators are best for different timeframes helps you choose the right tools. Understanding how Bitcoin indicators work also helps you interpret what different timeframes are telling you.
Ignoring market context
Indicators work differently in different market conditions. Using the same approach in trending and sideways markets often leads to losses.
The problem: Trend-following indicators (moving averages, MACD) work well in trending markets but generate false signals in choppy, sideways conditions. Momentum oscillators (RSI, Stochastic) can stay overbought or oversold for extended periods in strong trends.
The solution: Adjust your approach based on market structure. In trending markets, favor trend indicators and use momentum oscillators to time entries. In sideways markets, favor range-bound strategies and use volatility indicators to identify breakout zones.
Chasing perfect signals
No indicator is perfect. Waiting for the "perfect" signal often means missing opportunities or entering too late.
The problem: Trying to find an indicator that never gives false signals is impossible. Every tool will generate losing trades. The goal isn't perfection—it's using indicators to improve your edge over time.
The solution: Accept that indicators provide probabilities, not certainties. Use them to improve your win rate and risk-reward ratio, not to eliminate losses entirely. Combine indicators with risk management (position sizing, stop-losses) to handle inevitable false signals.
Simplifying with curated indicator suites
If managing multiple indicators feels overwhelming, you can simplify by using curated indicator suites that combine related metrics into single endpoints or dashboards.
Cycle indicators combine metrics like the 200-week moving average, MVRV Z-Score, halving cycle analysis, and Pi Cycle Top into a unified view of cycle positioning. Instead of tracking each metric separately, you get a synthesized assessment of where Bitcoin sits in its cycle.
Momentum indicators combine short-term and medium-term RSI readings, along with trend momentum, into a single momentum assessment. This helps you understand momentum state across multiple timeframes without calculating each separately.
Volatility indicators combine ATR, Bollinger Band conditions, and realized volatility into a single risk assessment. This helps you understand current volatility levels and potential breakout zones without tracking multiple metrics.
HunchMachine's API provides access to pre-processed indicator suites that combine related metrics. For example, the BTC Overview endpoint combines price, momentum (RSI), volatility, and moving average signals into one snapshot. The RSI 14 Trend endpoint provides RSI readings across multiple timeframes with trend and momentum context.
For cycle analysis, endpoints like BTC 200W MA Distance and Halving Cycle provide long-term positioning context without needing to calculate moving averages or track halving dates manually.
These pre-processed endpoints return not just raw values but also interpreted summaries and trend classifications, making it easier to integrate indicator logic into your analysis without getting lost in calculations. They're particularly useful if you're building automated systems or want to focus on interpretation rather than data processing.
So… what Bitcoin indicators should you use?
The answer depends on your objective. For trend following, use moving averages and MACD on weekly timeframes. For swing trading, combine RSI with Bollinger Bands on daily timeframes. For long-term accumulation, use cycle indicators like the 200-week MA, MVRV Z-Score, and Pi Cycle Top on monthly timeframes.
The key is choosing 2-3 indicators that measure different things (trend, momentum, volume) and matching their timeframes to your objective. Avoid indicator overload by not using multiple tools that measure the same thing. Understand that indicators provide probabilities, not certainties, and combine them with risk management.
If you're new to indicators or want a simpler approach, following accounts like @InvestWithGPT that synthesize indicator data into easy-to-follow insights can help you understand market structure without learning every calculation yourself.
For those building their own systems, using curated indicator suites or APIs that provide pre-processed, interpreted indicator values can reduce complexity while still giving you the insights you need to make better decisions. If you're specifically focused on timing entries and exits, top Bitcoin indicators for market timing provides a detailed guide on combining indicators for better timing decisions.
The question "What Bitcoin indicators should I use?" stops being about collecting every available tool and becomes: "What's my objective, which 2-3 indicators measure what I need to know, and how do I combine them with risk management to improve my edge?"
Choose indicators that match your timeframe, understand their strengths and weaknesses, and use them consistently. Less is often more when it comes to indicators—a few well-chosen tools used correctly beat a dozen conflicting signals every time.