Top Bitcoin indicators for market timing

When people ask "Top Bitcoin indicators for market timing?", they're usually trying to identify which tools can help them spot optimal entry and exit points within Bitcoin's cycles, improving their returns by buying lower and selling higher.
Market timing means spotting when conditions favor accumulation versus when they favor taking profits. It's not about predicting exact dates. It's about understanding where Bitcoin sits in its cycle and adjusting your approach accordingly. The best timing indicators combine macro context with technical signals and on-chain data to give you a clearer picture of cycle positioning. Understanding which Bitcoin indicators are best for different purposes helps you choose the right tools for timing decisions.
This article covers:
- Timing vs time in the market and when each approach makes sense
- Cycle-specific indicators for identifying major turning points
- Trend and momentum tools for timing entries within cycles
- Sentiment and flow indicators that signal extremes
- Macro and ETF data that can extend or compress cycles
- Dynamic DCA strategies that combine time in market with better timing
Timing the market vs time in the market
The classic debate in investing is whether it's better to "time the market" or have "time in the market." For Bitcoin, both approaches matter, but they work best when combined strategically.
Time in the market means staying invested consistently, regardless of price. The logic is that Bitcoin's long-term trend is up, so being invested beats trying to time entries and exits. This approach works well for most people because it removes emotion and decision fatigue. You just buy regularly and hold.
Timing the market means trying to enter at lower prices and exit at higher prices. The challenge is that perfect timing is nearly impossible. Most people who try to time the market end up buying high and selling low, driven by fear and greed rather than analysis.
Why Bitcoin cycles change the equation
Bitcoin's cycles create opportunities that pure "time in the market" misses. During bear markets, Bitcoin can fall 70-85% from cycle highs. Buying during these periods significantly improves your cost basis compared to buying at cycle tops. Similarly, taking some profits near cycle tops can protect gains that might otherwise disappear in the subsequent bear market.
But trying to time every move is a recipe for disaster. Most traders who attempt perfect timing end up underperforming simple buy-and-hold because they miss the biggest moves while trying to avoid the smallest corrections.
The hybrid approach
The most effective strategy combines both approaches. Use "time in the market" as your base strategy, but use indicators to tilt your approach. During accumulation phases (when indicators suggest deep value), increase your buying. During distribution phases (when indicators suggest cycle tops), reduce buying or take some profits. You're not trying to time perfectly. You're adjusting your approach based on cycle positioning.
This is where dynamic DCA comes in. Instead of buying the same amount every month regardless of price, you buy more when indicators suggest better value and less (or take profits) when indicators suggest cycle extremes. You're still consistently investing, but you're tilting your approach based on market structure.
Cycle-specific indicators
Cycle indicators help you understand where Bitcoin sits within its multi-year cycles. They're not for day trading. They're for strategic positioning: knowing when to accumulate aggressively versus when to be more cautious. If you're new to indicators, understanding how Bitcoin indicators work helps you interpret what cycle indicators are measuring and why those measurements matter for timing.
Pi Cycle Top Indicator
The Pi Cycle Top Indicator uses the relationship between the 111-day and 350-day moving averages to identify potential cycle peaks. It calculates two moving averages: a 111-day MA (short-term momentum) and a 350-day MA (long-term trend). When short-term momentum becomes extremely elevated relative to long-term momentum (111-day MA crossing above 2× 350-day MA), it suggests the market has reached unsustainable extremes.
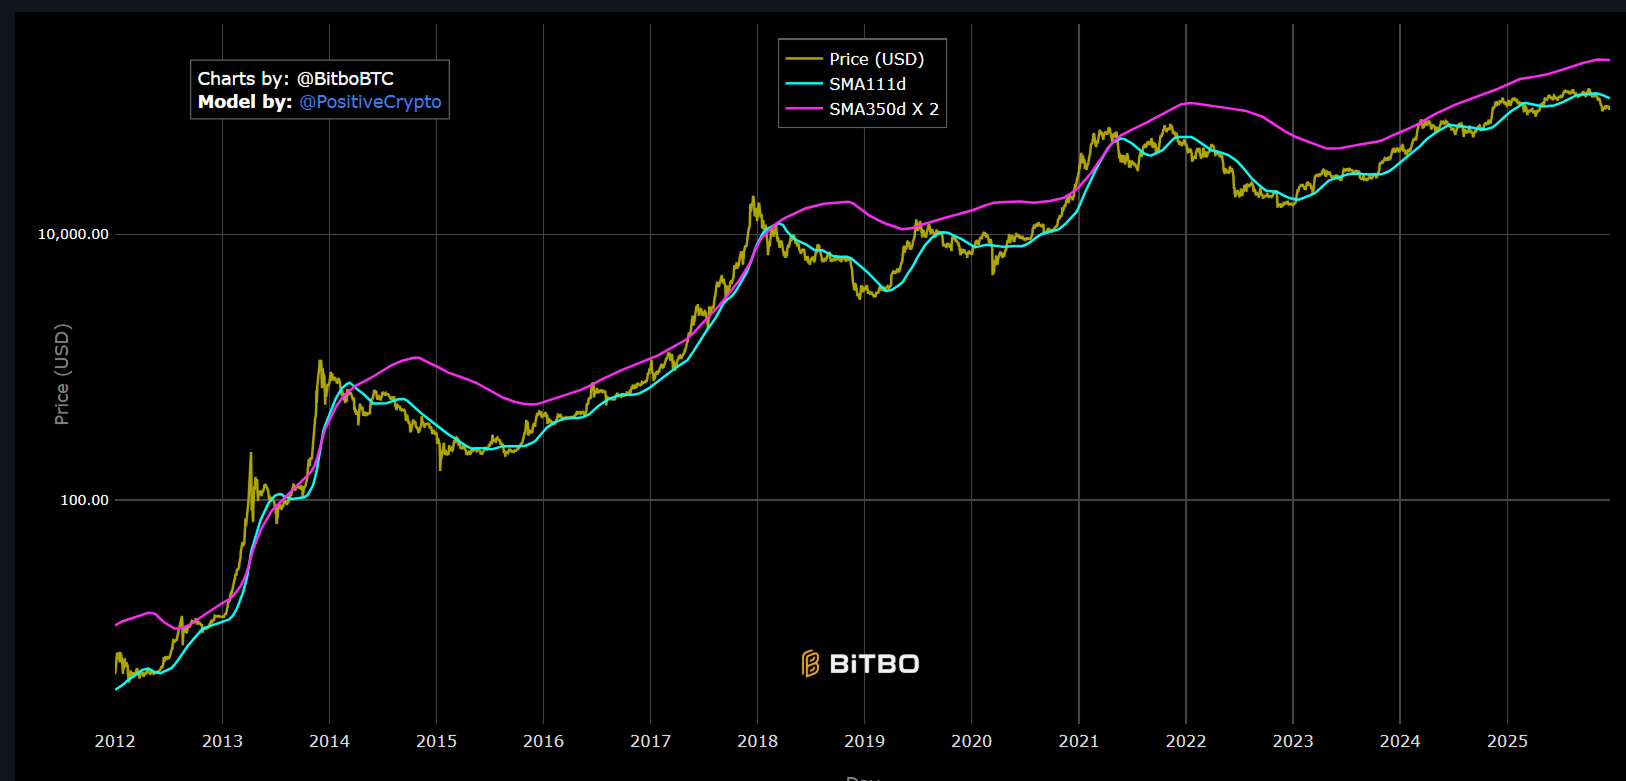
The Pi Cycle Top doesn't predict exact tops. Instead, it identifies when conditions match historical top patterns. Historically, this indicator has flashed near major cycle peaks in 2013, 2017, and 2021. When it triggers, it suggests you're in the late stages of a bull cycle, where risk is elevated and taking some profits makes sense.
When the Pi Cycle Top indicator shows "Approaching" or "Triggered," it's a signal to be more cautious. This doesn't mean sell everything. It means consider taking some profits, reducing new buying, or increasing your cash position. The goal is to protect gains rather than trying to time the exact top.
MVRV Z-Score
MVRV (Market Value to Realized Value) Z-Score compares Bitcoin's market capitalization to its realized capitalization. Realized cap values each coin at the price it last moved, providing a measure of the average cost basis of all Bitcoin holders. When MVRV is high, current holders have large unrealized gains, creating psychological pressure to sell. When MVRV is low, most holders are at a loss, reducing selling pressure. The Z-Score standardizes this ratio to show how extreme current conditions are relative to historical averages.
MVRV Z-Score reflects market psychology
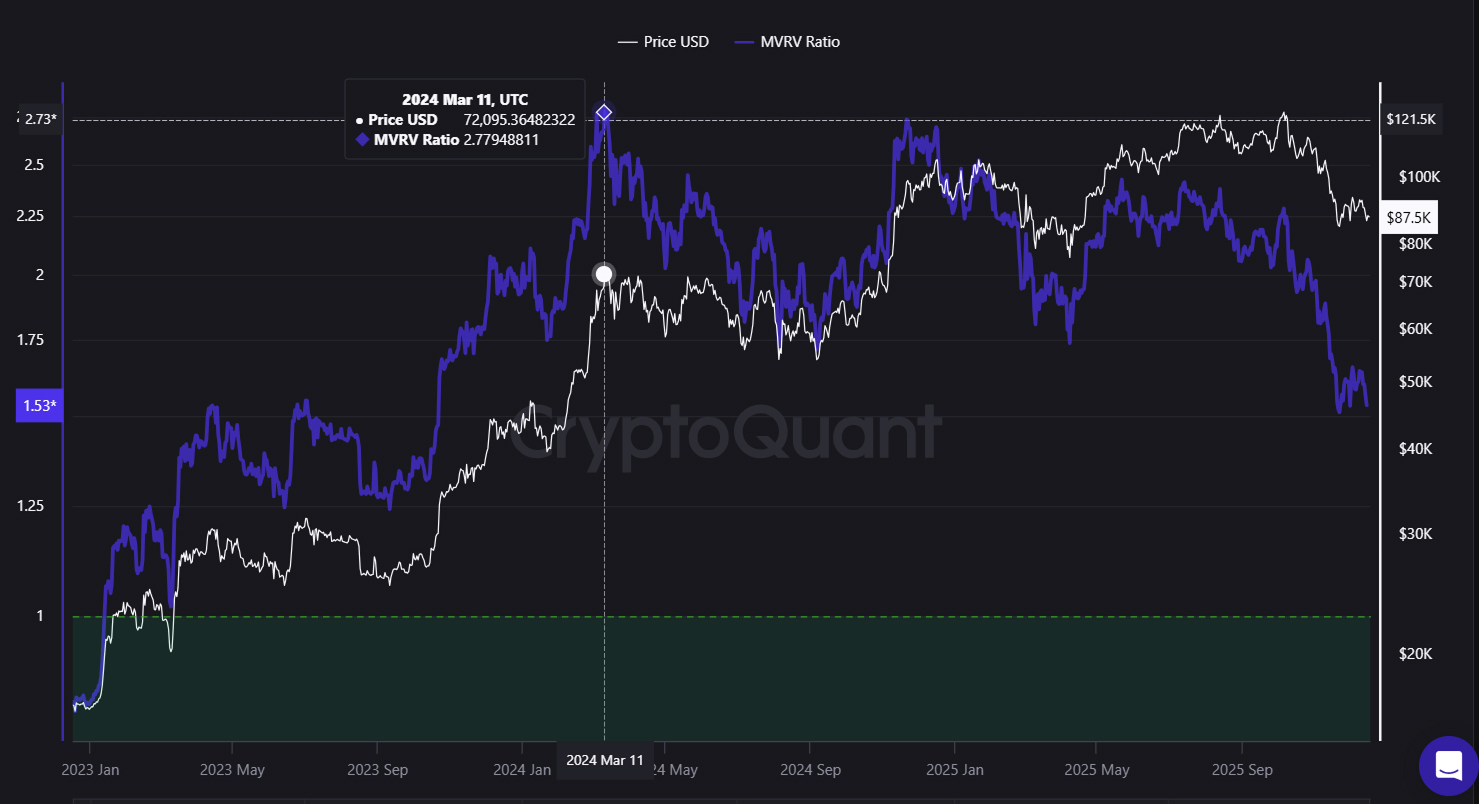
Values above 7 have historically coincided with cycle tops, when euphoria is extreme and most holders are sitting on large profits. Values below 0 have historically coincided with cycle bottoms, when fear is extreme and most holders are at a loss.
Reading MVRV for timing decisions
When MVRV Z-Score is below 0, conditions favor accumulation. Most holders are at a loss, selling pressure is reduced, and you're buying when others are fearful. When MVRV Z-Score is above 7, conditions suggest cycle extremes. Most holders have large gains, euphoria is high, and taking some profits makes sense.
The key is using MVRV for cycle context, not short-term timing. A high MVRV reading doesn't mean "sell immediately." It means we're likely in the late stages of a bull cycle, so be more cautious with new buying and consider taking some profits.
Puell Multiple
The Puell Multiple compares daily miner revenue to the 365-day moving average. Miner revenue is calculated as (Bitcoin price × block reward × blocks per day), and the Puell Multiple divides current daily revenue by the 365-day average. When the ratio is high (>4), miners are making significantly more than average. When it's low (<0.5), miners are struggling.
Miners are a constant source of selling pressure
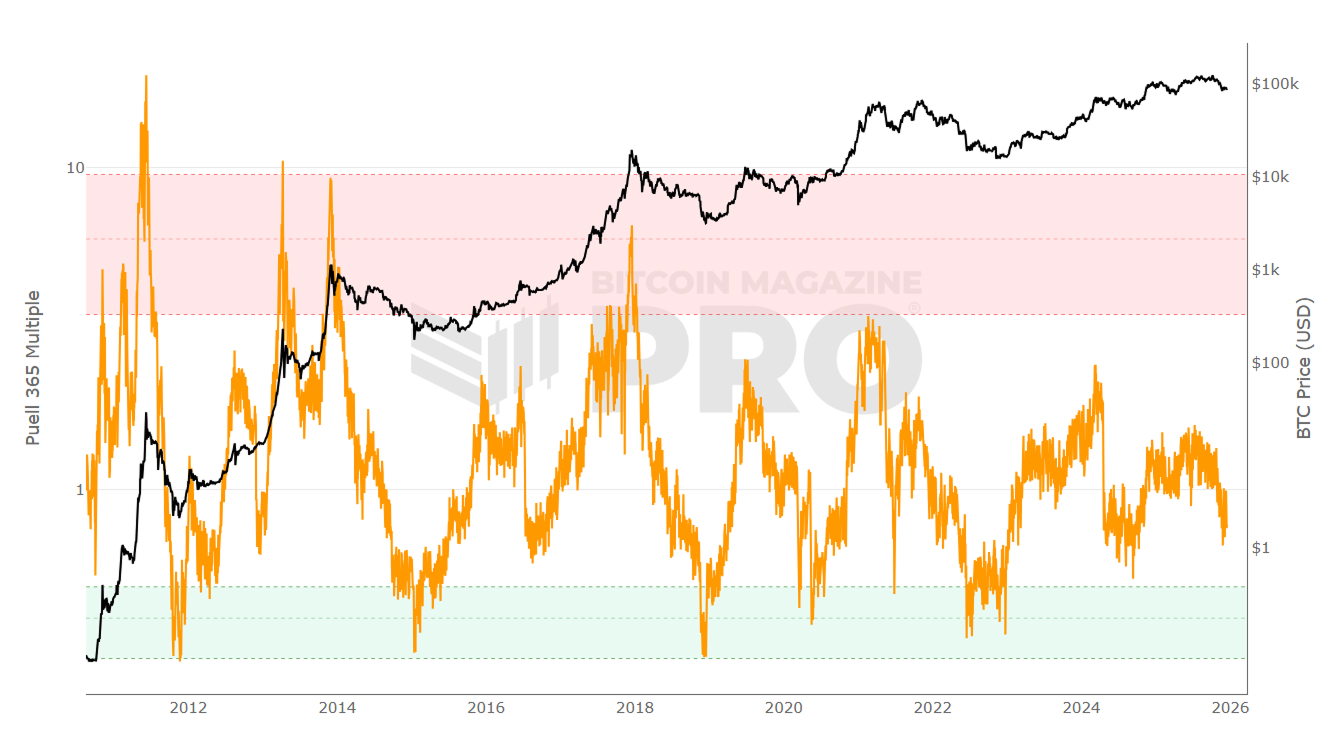
They need to sell Bitcoin to pay expenses (electricity, equipment, operations). When they're making high profits (high Puell Multiple), they sell more, adding supply to the market. When they're struggling (low Puell Multiple), they sell less, reducing supply. This creates a natural cycle tied to mining profitability.
Historically, high Puell Multiple readings (>4) have often coincided with cycle tops, as miner selling adds supply pressure during euphoric phases. Low readings (<0.5) have often coincided with cycle bottoms, as reduced miner selling helps stabilize prices.
Using Puell Multiple in practice
Low Puell Multiple (<0.5) suggests accumulation opportunities. Miners are struggling, selling pressure is reduced, and you're buying when mining economics are depressed. High Puell Multiple (>4) suggests cycle extremes. Miners are making high profits, adding supply pressure, and conditions favor being more cautious. Combine Puell Multiple with other cycle indicators. If MVRV Z-Score is high, Pi Cycle Top is flashing, and Puell Multiple is elevated, multiple signals are suggesting cycle extremes.
Trend and momentum tools
While cycle indicators help with strategic positioning, trend and momentum tools help you time entries and exits within those cycles. They're not for predicting cycle tops and bottoms, but for improving your timing within the broader cycle structure.
50/200-day moving average crossover
The relationship between the 50-day and 200-day moving averages provides one of the clearest signals of long-term trend changes. The 50-day MA represents medium-term momentum, while the 200-day MA represents long-term trend. When the 50-day crosses above the 200-day (a "golden cross"), it suggests momentum is building and a new uptrend may be forming. When it crosses below (a "death cross"), it suggests momentum is weakening and a downtrend may be forming.
These crossovers don't happen often
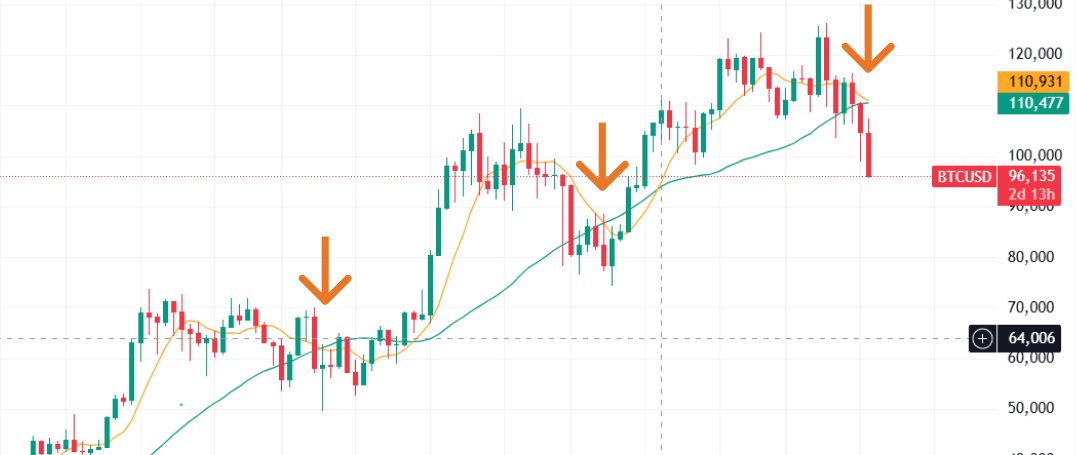
A golden cross might occur once every few years, making it a significant signal. When it occurs during low MVRV conditions (cycle bottom), it can signal the start of a new bull cycle. When it occurs during high MVRV conditions (late cycle), it might be a false signal or the start of a final rally before the top.
A golden cross during accumulation phases (low MVRV, price below 200-week MA) suggests a favorable entry opportunity. The trend is turning up, and you're entering early in the cycle. A death cross during distribution phases (high MVRV, elevated indicators) suggests it's time to be more defensive, reducing exposure or taking profits.
For weekly timeframes, the 50/200 MA Trend indicator provides similar signals on longer timeframes, helping you understand structural trend changes rather than just short-term noise.
MACD for shorter swings
MACD (Moving Average Convergence Divergence) helps time shorter swings within the broader cycle. It compares a 12-day EMA to a 26-day EMA. When the MACD line crosses above the signal line, it suggests momentum is building. When it crosses below, it suggests momentum is weakening. The histogram shows the difference between MACD and signal, indicating momentum acceleration or deceleration.
MACD helps you time entries within trends
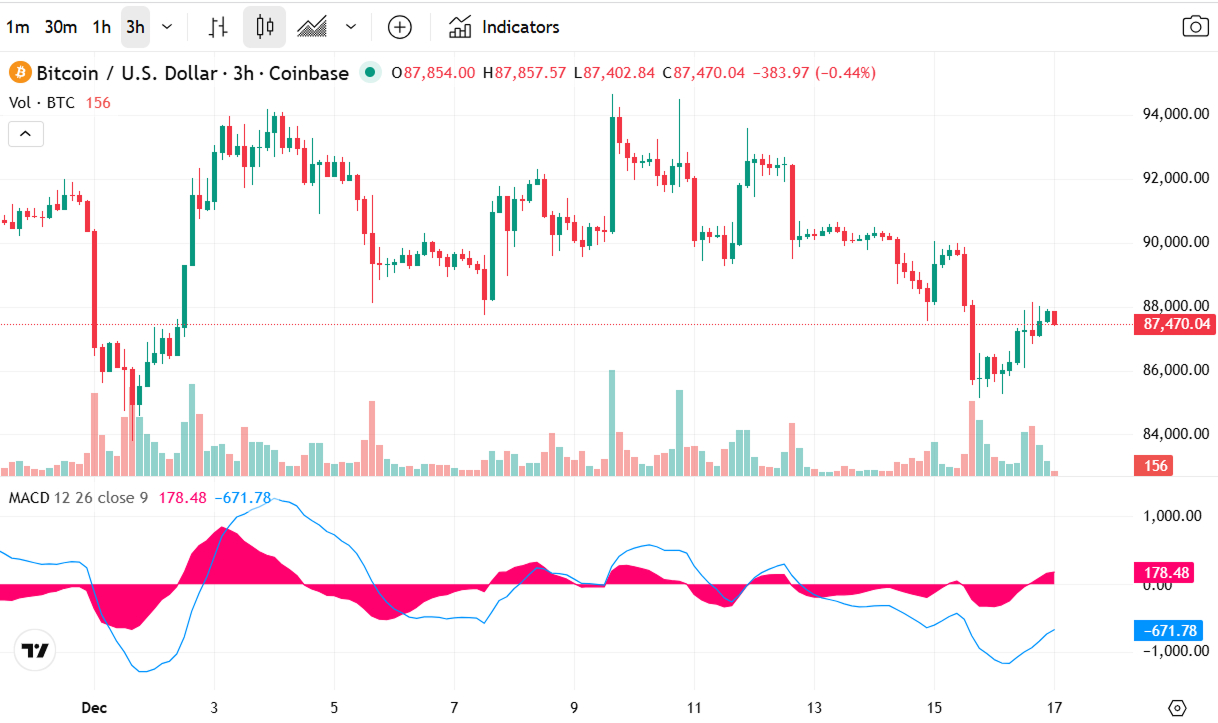
In an uptrend, MACD pullbacks to the signal line often provide entry opportunities. In a downtrend, MACD bounces to the signal line often provide exit opportunities. It's not for predicting cycle tops, but for improving timing within the current cycle phase.
During bull markets, use MACD to time entries on pullbacks. When MACD pulls back to the signal line while the overall trend remains up, it often signals a good entry point. During bear markets or cycle tops, use MACD to time exits. When MACD makes lower highs while price makes new highs (divergence), it suggests momentum is weakening and taking profits makes sense.
Sentiment and flow indicators
Sentiment and flow indicators measure market psychology and capital flow. They help identify when markets reach extremes that often precede reversals.
Fear & Greed Index
The Crypto Fear & Greed Index measures market sentiment by analyzing volatility, market momentum, social media sentiment, surveys, and Bitcoin dominance. It ranges from 0 (extreme fear) to 100 (extreme greed). The index combines multiple data sources to quantify market psychology. Extreme fear (0-25) typically occurs during bear markets and cycle bottoms, when most people are scared and want to sell. Extreme greed (75-100) typically occurs during bull markets and cycle tops, when most people are euphoric and want to buy.
Sentiment extremes often mark cycle turning points
Extreme fear during bear markets often signals accumulation opportunities, as fear creates the conditions for future rallies. Extreme greed during bull markets often signals distribution opportunities, as greed creates the conditions for future corrections.
Extreme fear readings (0-25) during bear markets or when cycle indicators suggest accumulation (low MVRV, below 200-week MA) can signal favorable entry conditions. Extreme greed readings (75-100) during bull markets or when cycle indicators suggest cycle tops (high MVRV, Pi Cycle Top flashing) can signal favorable exit conditions.
The key is combining sentiment with cycle indicators
Extreme greed alone doesn't mean "sell everything." But extreme greed combined with high MVRV, elevated Pi Cycle Top, and other cycle signals suggests multiple indicators are flashing caution.
Funding rates and open interest
Funding rates in Bitcoin derivatives markets reflect the cost of holding long positions. They reset every 8 hours in perpetual futures markets. Positive funding means longs pay shorts, indicating more people want to be long. Negative funding means shorts pay longs, indicating more people want to be short. Extremely positive funding (>0.1% per 8 hours) suggests extreme bullish positioning.
Open interest measures the total value of outstanding derivative contracts. When open interest is elevated while funding is extremely positive, it suggests leveraged long positions are stretched, creating vulnerability to deleveraging events.
Extreme funding rates combined with elevated open interest often precede market tops
When too many people are leveraged long and paying high funding costs, a small correction can trigger cascading liquidations that accelerate the reversal. This creates the "liquidation cascade" pattern common at cycle tops.
When funding rates are extremely positive (>0.1% per 8 hours) and open interest is elevated, it suggests leveraged positioning is stretched. This doesn't mean "sell immediately," but it suggests conditions are becoming vulnerable. Combined with cycle indicators suggesting cycle tops (high MVRV, Pi Cycle Top), it strengthens the case for taking some profits or reducing exposure.
Conversely, negative funding rates during bear markets can signal oversold conditions, though this is less reliable than positive funding during bull markets.
Macro and ETF data
Bitcoin cycles don't exist in isolation. Macro-economic conditions and institutional flows can extend or compress cycle timing, making it important to understand how external factors interact with Bitcoin's internal cycle structure.
Macro-economic indicators
Interest rates, liquidity conditions, and monetary policy significantly impact Bitcoin cycles. When the Federal Reserve cuts rates and injects liquidity, risk appetite increases, supporting Bitcoin and crypto markets. When the Fed tightens monetary policy, risk appetite decreases, creating headwinds for risk assets.
During periods of monetary easing, Bitcoin cycles can extend beyond historical averages
Abundant liquidity supports risk assets, allowing bull markets to run longer and reach higher extremes. During periods of monetary tightening (rate hikes, quantitative tightening), cycles can compress, with tops arriving earlier and corrections being more severe.
The introduction of spot Bitcoin ETFs in 2024 created a new dynamic. Institutional capital flowing into Bitcoin ETFs can extend the BTC-led phase of cycles, delaying rotation into altcoins and potentially extending bull markets beyond historical patterns.
How macro conditions modify cycle timing
Monitor macro conditions to understand whether the current cycle might extend or compress. If monetary policy is easing and ETF flows are strong, cycle indicators might take longer to reach extremes, or extremes might become more extreme. If monetary policy is tightening and ETF flows are slowing, cycle indicators might reach extremes faster, or the cycle might compress.
Macro conditions can modify cycle timing
This doesn't mean ignoring cycle indicators. A high MVRV reading during monetary easing might not signal an immediate top, but it still suggests elevated risk. A high MVRV reading during monetary tightening might signal a more immediate top, as macro headwinds combine with cycle extremes.
ETF flows
Spot Bitcoin ETF flows provide real-time data on institutional demand. When ETF flows are strong and sustained, it suggests institutional capital is supporting Bitcoin prices, potentially extending cycles. When ETF flows slow or reverse, it suggests institutional support is waning, potentially accelerating cycle transitions.
Strong ETF inflows combined with cycle indicators create a mixed signal
When cycle indicators suggest cycle tops (high MVRV, Pi Cycle Top) but ETF flows remain strong, the cycle indicators suggest caution while ETF flows suggest institutional support remains. In this scenario, you might take some profits but not exit entirely, as institutional flows could extend the cycle.
Weak ETF flows or outflows combined with cycle indicators suggesting cycle tops strengthen the case for taking profits.
Multiple signals are aligning
Cycle extremes, weakening institutional support, and potentially deteriorating macro conditions all point in the same direction.
Dynamic DCA: combining time in market with better timing
Most people know about dollar-cost averaging (DCA), where you invest a fixed amount regularly regardless of price. Dynamic DCA takes this concept and adjusts it based on cycle indicators, allowing you to stay consistently invested while tilting your approach based on market structure.
Instead of buying the same amount every month, you adjust your buying based on cycle positioning. During accumulation phases (low MVRV, below 200-week MA, extreme fear), you increase your monthly buying. During distribution phases (high MVRV, Pi Cycle Top flashing, extreme greed), you reduce buying or take some profits.
A practical allocation framework
Here's a practical allocation framework: Deep accumulation (MVRV < 0, price below 200-week MA) suggests buying 2x your normal amount. Moderate accumulation (MVRV 0-3, price near 200-week MA) suggests buying 1.5x your normal amount. Neutral conditions (MVRV 3-7, price above 200-week MA) suggest buying your normal amount. Elevated conditions (MVRV 7-10, Pi Cycle Top approaching) suggest buying 0.5x your normal amount. Extreme conditions (MVRV > 10, Pi Cycle Top triggered) suggest stopping new buying and considering taking 20-30% profits.
This approach keeps you consistently invested (time in the market) while improving your cost basis through better timing (timing the market). You're not trying to time perfectly. You're adjusting your approach based on cycle positioning.
During accumulation phases, Bitcoin is undervalued relative to holder cost basis. Buying more during these periods improves your average entry price. During distribution phases, Bitcoin is overvalued relative to holder cost basis. Buying less (or taking profits) during these periods protects gains and reduces risk. The key is staying consistent. Even during elevated phases, you're still buying, just less. This keeps you invested while reducing risk during cycle extremes.
Automating dynamic DCA
Monitoring cycle indicators manually can be time-consuming. APIs that provide pre-processed cycle indicators can simplify this process. HunchMachine's API includes endpoints like MVRV Z-Score, Pi Cycle Top, BTC 200W MA Distance, and Fear & Greed Index that return not just raw values but also interpreted summaries and cycle phase classifications.
These endpoints help you understand cycle positioning without needing to manually calculate moving averages, track halving dates, or process on-chain data yourself. They return context like "approaching cycle top" or "deep accumulation zone" that helps you adjust your DCA allocation accordingly.
For those who want to fully automate dynamic DCA, the Crypto Investment Insight automation combines macro, meso, and micro indicators into a single workflow. It provides cycle context (macro), market structure (meso), and short-term momentum (micro), helping you understand not just where Bitcoin sits in its cycle, but also current market conditions that might affect your DCA timing.
Practical application: combining indicators for timing
The most effective approach combines multiple indicators across different categories. Start with cycle indicators to understand where Bitcoin sits in its cycle. Check MVRV Z-Score, Pi Cycle Top, and Halving Cycle to understand cycle phase. Are you in accumulation, expansion, or distribution?
Use trend indicators to confirm cycle context. If cycle indicators suggest accumulation (low MVRV) but price is well above the 200-week MA, there might be a mismatch. If cycle indicators suggest cycle top (high MVRV) but the 50/200-day crossover just occurred, the cycle might be extending. The key is choosing the right indicators for your objective, which is why understanding what Bitcoin indicators you should use based on your trading style matters for effective timing.
Check sentiment extremes to identify when markets reach psychological extremes. Extreme fear during accumulation phases strengthens the case for buying. Extreme greed during distribution phases strengthens the case for taking profits.
Monitor macro conditions to understand whether external factors support or conflict with cycle indicators. Monetary easing might extend cycles. Monetary tightening might compress them. ETF flows might extend the BTC-led phase.
Based on the combination of signals, adjust your approach. If multiple cycle indicators suggest accumulation (low MVRV, below 200-week MA, extreme fear), increase buying. If multiple indicators suggest cycle extremes (high MVRV, Pi Cycle Top flashing, extreme greed, elevated funding), reduce buying or take some profits.
Putting it all together: a real example
Bitcoin is trading at $80,000. MVRV Z-Score is 8.5 (historically extreme), Pi Cycle Top shows "Approaching," Fear & Greed Index is 85 (extreme greed), funding rates are 0.15% per 8 hours (extremely positive), and open interest is elevated. Multiple cycle indicators, sentiment indicators, and flow indicators are all suggesting cycle extremes.
This doesn't mean "sell everything immediately." But it does suggest taking some profits (maybe 20-30% of your position), reducing new buying, and being more defensive. The goal isn't to time the exact top. It's to protect gains when multiple indicators suggest elevated risk.
So… top Bitcoin indicators for market timing?
The top Bitcoin indicators for market timing combine cycle positioning, trend confirmation, sentiment extremes, and macro context. Cycle indicators like Pi Cycle Top, MVRV Z-Score, and Puell Multiple help you understand where Bitcoin sits in its cycle. Trend indicators like 50/200-day crossovers help confirm cycle context. Sentiment indicators like the Fear & Greed Index and funding rates help identify extremes. Macro indicators help you understand whether cycles might extend or compress.
But the most important insight is that perfect timing is nearly impossible. Instead of trying to time every move, use indicators to tilt your approach. During accumulation phases, buy more. During distribution phases, buy less or take some profits. This dynamic DCA approach combines "time in the market" with better timing, improving your cost basis while staying consistently invested.
The question "Top Bitcoin indicators for market timing?" stops being about finding the perfect indicator and becomes: "How do I combine cycle indicators, trend tools, and sentiment metrics to understand cycle positioning, and how do I use that understanding to adjust my approach without trying to time perfectly?"
Use indicators to understand structure, not to predict exact dates. Combine multiple signals for confirmation. Adjust your approach based on cycle positioning. And remember that staying consistently invested with better timing beats trying to time perfectly every time.
Monitor the indicators, understand the context, and adjust your positioning as signals align. Market timing isn't about perfection. It's about improving your edge while staying invested for the long term.