How long does each Bitcoin cycle last?

When people ask "How long does each Bitcoin cycle last?", they're usually trying to understand the rhythm of Bitcoin's market movements and how to time their decisions within that framework.
Bitcoin cycles typically last around four years, driven by halving events that occur roughly every 210,000 blocks. But the actual duration can vary, and understanding the phases within each cycle is more useful than fixating on a fixed calendar date.
This article covers:
- How halving events create Bitcoin's cyclical rhythm
- The typical length of past cycles
- The phases within each cycle and their approximate durations
- Factors that can extend or shorten cycles
- Why real-time monitoring matters more than historical averages
Bitcoin's halving-driven rhythm
Bitcoin's cycles aren't random. They're anchored to a fundamental mechanism built into the protocol: halving events.
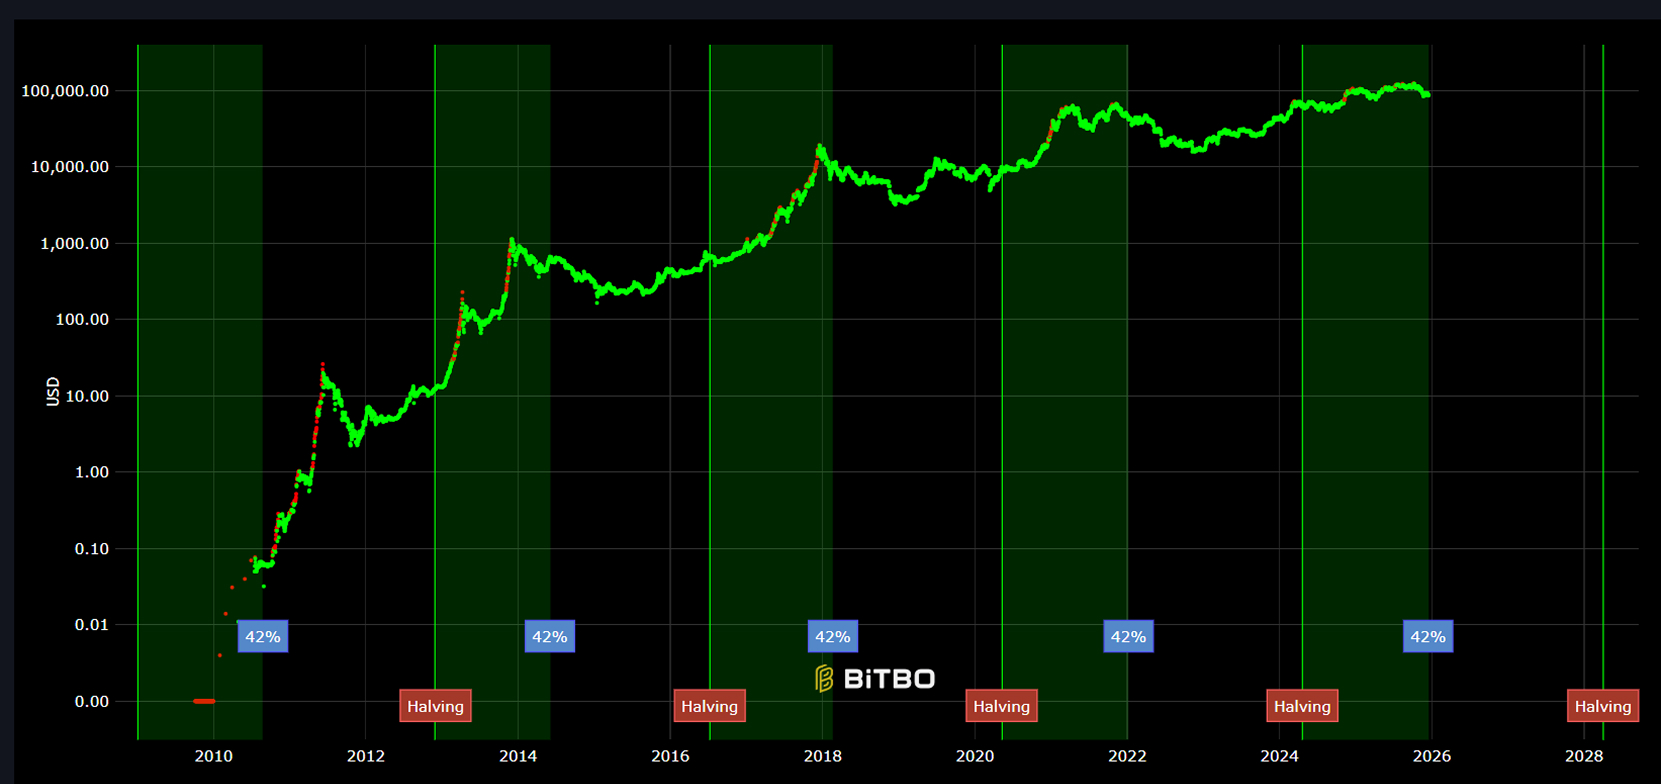
Every 210,000 blocks (approximately every four years), Bitcoin's block reward gets cut in half. This means the rate at which new Bitcoin enters circulation drops by 50%. The first halving occurred in 2012, reducing rewards from 50 BTC to 25 BTC per block. Subsequent halvings happened in 2016 (25 to 12.5 BTC), 2020 (12.5 to 6.25 BTC), and most recently in April 2024 (6.25 to 3.125 BTC).
This recurring supply shock creates a predictable rhythm. Each halving reduces new issuance, creating scarcity pressure that historically has preceded major bull markets. The cycle isn't just about price. It's about the interaction between supply reduction, adoption waves, liquidity conditions, and market psychology.
The four-year cadence isn't perfectly precise. Block times can vary slightly, so halvings don't happen exactly every 1,461 days. But they're close enough that the market has developed a clear pattern around them: accumulation after the previous cycle's end, expansion after the halving, euphoria as the cycle matures, and then correction back to accumulation.
Typical length of past cycles
Looking at Bitcoin's history, cycles have generally followed a consistent pattern in terms of duration.
From low to peak to low, past cycles have typically lasted somewhere between 1,000 and 1,500 days. That's roughly 2.7 to 4.1 years, with most clustering around the four-year mark.
The breakdown within each cycle:
- 12–18 months of bull run after the halving, where most of the price appreciation occurs
- Bear phase and consolidation that can last 1–2 years, bringing price back down and setting up the next accumulation phase
For example:
-
2012–2016 cycle: From the 2012 halving to the 2016 halving, Bitcoin went from around $12 to a peak near $1,100 in late 2013, then corrected and consolidated for roughly two years before the next halving.
-
2016–2020 cycle: From the 2016 halving to the 2020 halving, Bitcoin bottomed around $3,200 in late 2018, peaked near $20,000 in December 2017, then spent about two years in bear market territory.
-
2020–2024 cycle: From the 2020 halving to the 2024 halving, Bitcoin bottomed around $3,500 in March 2020, peaked in a distributed zone between April and November 2021 (reaching $69,000), then corrected to around $16,000 by late 2022 before recovering.
The pattern is clear. Halving events create the structural anchor, but the actual cycle length varies based on how quickly euphoria builds, how severe the correction is, and how long consolidation takes.
Phases and their durations
Within each four-year cycle, Bitcoin moves through distinct phases. Understanding these phases and their typical durations helps you set realistic expectations.
1. Accumulation (months to a year)
After a bear market bottom, price consolidates at relatively low levels. Early adopters and long-term holders accumulate. Sentiment is cautious or fearful. This phase can last anywhere from a few months to over a year, depending on how deep the previous correction was and how quickly new narratives emerge.
2. Growth/Expansion (months)
After the halving, price begins trending upward more consistently. The supply reduction creates scarcity pressure. Adoption increases. Momentum builds. This phase typically lasts several months to over a year, and it's where most of the bull market gains happen. The expansion phase often accelerates as it progresses.
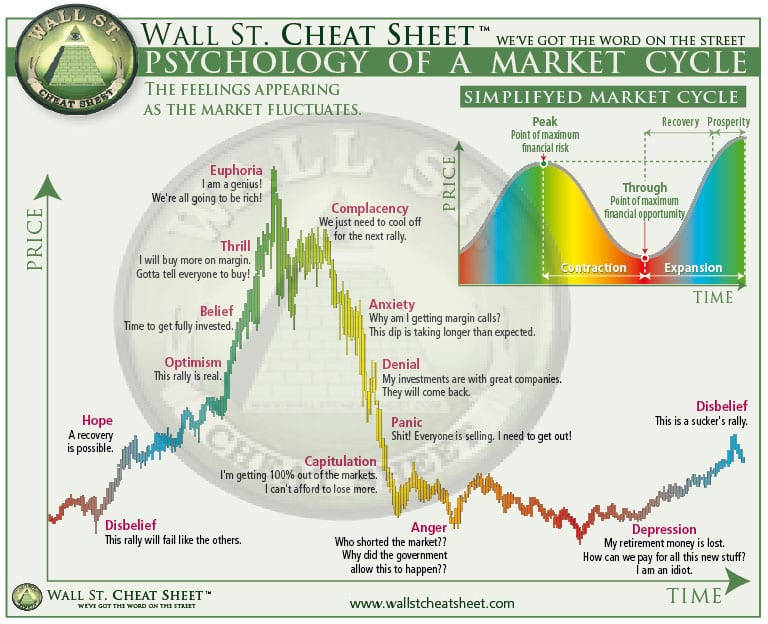
3. Euphoria/Peak (weeks to months)
Price accelerates into parabolic moves. Media coverage peaks. New retail investors flood in. Extreme optimism dominates. This phase is typically the shortest, often just weeks to a few months, but it's where cycle tops form. The euphoria phase is intense but brief.
4. Crash/Consolidation (1–2 years)
The euphoria exhausts itself. Price corrects sharply, often falling 70–85% from the peak. Sentiment shifts from greed to fear. This correction phase can last 1–2 years, bringing price back down and setting up the next accumulation phase. Understanding when this transition from euphoria to bear market occurs helps you recognize cycle endings in real time rather than trying to predict exact dates.
These durations are approximate. Some cycles have longer accumulation phases, others have shorter euphoria phases. The key is understanding which phase you're likely in, not memorizing exact timelines.
If you want to track where Bitcoin currently sits within its halving cycle, HunchMachine's Halving Cycle indicator provides real-time progress percentage and typical cycle phase labels, helping you understand whether the market is in accumulation, expansion, late bull, or pre-halving cooldown.
Factors that can extend or shorten cycles
While the four-year halving rhythm provides a structural framework, actual cycle lengths can vary based on several factors that interact with Bitcoin's supply mechanics.
Macro conditions and regulation
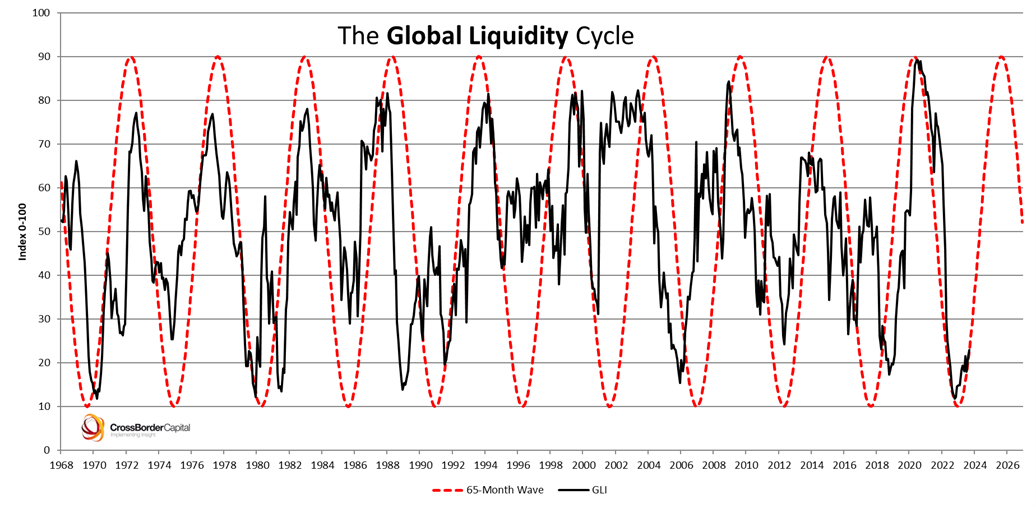
Macro-economic conditions play a significant role. Liquidity conditions, interest rates, and monetary policy can dramatically impact cycle duration. When the Federal Reserve cuts rates and injects liquidity into the system, risk assets like Bitcoin tend to benefit. Abundant liquidity can extend bull markets beyond historical averages by keeping capital flowing into crypto markets. Conversely, aggressive monetary tightening can truncate cycles earlier by reducing available capital and increasing the opportunity cost of holding non-yielding assets.
The current cycle has been heavily influenced by Fed policy shifts. When the Fed pivoted toward easing in late 2023 and early 2024, Bitcoin responded with strong upward momentum. Treasury yields and global liquidity flows have also created tailwinds or headwinds depending on the macro environment. Historical examples show this clearly: the 2020–2021 cycle benefited from massive liquidity injection during COVID-19 stimulus programs, while the 2018 bear market coincided with Fed rate hikes and quantitative tightening.
Regulatory developments can accelerate or delay adoption waves, which in turn affects cycle length. Positive regulatory clarity can extend cycles by bringing in new capital from institutions and retail investors who were previously hesitant. When countries like El Salvador adopted Bitcoin as legal tender in 2021, it created a narrative boost that extended the euphoria phase. Negative regulatory actions can compress cycles by creating uncertainty and reducing access. China's mining ban in 2021 created a temporary shock, though the market recovered relatively quickly.
Institutional adoption and ETFs
Institutional adoption introduces a new dynamic that didn't exist in earlier cycles. The introduction of spot Bitcoin ETFs in January 2024 created a structural shift in how institutions can access Bitcoin. These ETFs have captured billions in flows, creating sustained buying pressure that wasn't present in previous, more retail-dominated cycles.
However, it's worth being measured about the ETF impact. While ETFs have brought in significant capital, they've also created new dynamics. ETF flows can be volatile, with periods of heavy inflows followed by outflows as institutions rebalance or adjust allocations. The ETF structure also means that institutional demand is more transparent and trackable, which can create different market dynamics than the opaque retail flows of earlier cycles.
Some analysts argue that ETFs could extend the current cycle by providing a steady source of demand. Others point out that ETF flows are still subject to macro conditions and risk appetite, so they may not fundamentally change the four-year rhythm as much as initially expected. The data is still emerging, and it will take another full cycle to understand how ETFs truly impact cycle length.
Market structure evolution also matters. As Bitcoin matures, the infrastructure around it becomes more sophisticated. Better derivatives markets, improved custody solutions, and increased liquidity can create smoother transitions between phases. This might make cycles less volatile, but it's unclear whether it extends or compresses their duration. More liquid markets can absorb larger flows without extreme price movements, potentially allowing cycles to run longer before hitting exhaustion points.
The super-cycle debate
Then there's the "super-cycle" argument that periodically resurfaces. Some analysts argue that Bitcoin may be entering a super-cycle that extends beyond the traditional four-year rhythm. The argument typically goes that institutional adoption, ETF flows, and favorable macro conditions could create a longer, more sustained bull market that doesn't follow the historical pattern as closely.
This isn't the first time the super-cycle thesis has appeared. During the 2020–2021 cycle, many analysts predicted that institutional adoption and corporate treasury allocations would create a super-cycle that extended well beyond the traditional four-year cadence. The narrative was compelling: MicroStrategy buying billions in Bitcoin, Tesla adding Bitcoin to its balance sheet, and major institutions entering the space suggested a structural shift.
But the super-cycle didn't materialize. Despite strong institutional interest, the 2020–2021 cycle still peaked around the typical 12–18 month post-halving window (November 2021, roughly 18 months after the May 2020 halving). The subsequent bear market was severe, with Bitcoin falling from $69,000 to around $16,000, a 77% drawdown that was consistent with previous cycle corrections.
This historical precedent is worth remembering. While institutional adoption and ETFs are new factors, the four-year halving rhythm has proven remarkably resilient across multiple cycles. The halving creates a structural anchor that has consistently influenced market behavior, even as other factors have evolved.
The reality is probably somewhere in between. The halving creates the structural anchor, but macro conditions, adoption waves, and market structure can compress or extend individual cycles. A cycle might be shorter if macro conditions turn hostile early, or longer if institutional flows sustain momentum beyond historical averages. But betting against the four-year rhythm has historically been a losing proposition, even when compelling narratives suggested it might change. The halving mechanism is hardcoded into Bitcoin's protocol, and it has consistently created supply shocks that influence market behavior, regardless of how other factors evolve.
So… how long does each Bitcoin cycle last?
Based on historical patterns, Bitcoin cycles typically last around four years, from halving to halving, with the full cycle (low to peak to low) spanning roughly 1,000 to 1,500 days.
But fixating on exact calendar dates is less useful than understanding the phases within each cycle and monitoring real-time indicators to see where you are right now.
What makes more sense is:
- Track the halving calendar to understand the structural framework (when was the last halving, when is the next one expected)
- Monitor cycle phase indicators to understand which phase you're likely in (accumulation, expansion, euphoria, correction)
- Watch for cycle transition signals that suggest a phase change is occurring
- Adjust expectations based on macro context rather than assuming historical averages will repeat exactly
Tools like HunchMachine's cycle indicators API provide real-time data on halving cycle progress, typical cycle phases, and cycle positioning metrics. The Crypto Top & Bottom Detector automation monitors a basket of cycle indicators to help you understand whether the market is closer to accumulation, expansion, or distribution phases.
The question "How long does each Bitcoin cycle last?" stops being about finding a fixed number and becomes: "Where are we in the current cycle, and what phase are we likely transitioning into next?"
Cycles typically last around four years, but individual phases vary. Real-time indicators and cycle positioning data help you understand where you are right now, which is more actionable than trying to predict exact cycle lengths months in advance.