How do Bitcoin indicators work?

When people ask "How do Bitcoin indicators work?", they're usually trying to understand what these tools actually measure, why traders pay attention to them, and whether they can really help predict price movements.
Bitcoin indicators are mathematical calculations applied to price and volume data. They process historical information to reveal patterns, momentum shifts, and potential reversal zones that might not be obvious from just looking at a price chart. But understanding how they work, and why they work, requires looking beyond the math to the psychology that drives market behavior.
This article explains:
- What technical indicators are and how they process data
- The math behind major indicators in simple terms
- Why indicators work (hint: it's partly about psychology)
- Their limitations and when they fail
- A practical example of reading multiple indicators together
- How cycle indicators work differently from price-based tools
What are technical indicators?
Technical indicators are mathematical formulas that take price and volume data and transform it into signals that help you read market structure. Instead of just looking at whether Bitcoin went up or down today, indicators process that information to answer questions like: "Is this move sustainable?" "Are we in a trend or just bouncing around?" "Is the market overextended?"
Think of indicators as translators. Raw price data tells you what happened. Indicators help you understand what it might mean. If you're trying to decide which Bitcoin indicators are best for your needs, understanding how they work helps you make better choices.
How indicators process data:
Most indicators work by taking a series of price points (like the last 50 closing prices) and applying a mathematical formula to them. A moving average, for example, adds up those 50 prices and divides by 50, creating a smoothed line that shows the average price over that period. This smooths out daily noise to reveal the underlying trend.
Other indicators compare current conditions to historical patterns. RSI, for instance, compares recent gains to recent losses to measure momentum strength. It's not predicting the future. Instead, it's quantifying what's already happened in a way that helps you understand market structure.
The key insight is that indicators don't create new information. They summarize and organize data that markets already reflect. But by processing that data mathematically, they reveal patterns and relationships that aren't obvious from raw price charts.
The math behind major indicators (simplified)
You don't need to be a mathematician to use indicators, but understanding the basic concepts helps you interpret what they're telling you. Here's how the most common indicators work in simple terms.
Moving averages
A moving average is exactly what it sounds like: the average price over a set period, recalculated each day.
Simple Moving Average (SMA): Add up the last 50 closing prices and divide by 50. That's your 50-day SMA. Tomorrow, you drop the oldest price, add today's price, and recalculate. The line moves forward, always showing the average of the last 50 days.
Exponential Moving Average (EMA): Similar concept, but it gives more weight to recent prices. Instead of treating all 50 days equally, an EMA makes yesterday's price matter more than the price from 30 days ago. This makes EMAs react faster to price changes, which can help you catch trend shifts earlier.
Why it matters: Moving averages smooth out daily fluctuations to reveal the underlying trend. When price is above the moving average, the trend is generally up. When price is below, the trend is generally down. It's a simple way to see direction without getting distracted by daily noise.
MACD
MACD (Moving Average Convergence Divergence) shows the relationship between two exponential moving averages.
The calculation: Take a 12-day EMA and subtract a 26-day EMA. That difference creates the MACD line. Then create a 9-day EMA of that MACD line, and that's your signal line. The difference between MACD and signal creates the histogram.
What it shows: When the 12-day EMA is rising faster than the 26-day EMA, MACD goes up, showing momentum is building. When the 12-day EMA is rising slower (or falling), MACD goes down, showing momentum is weakening. The crossover between MACD and signal line often marks momentum shifts.
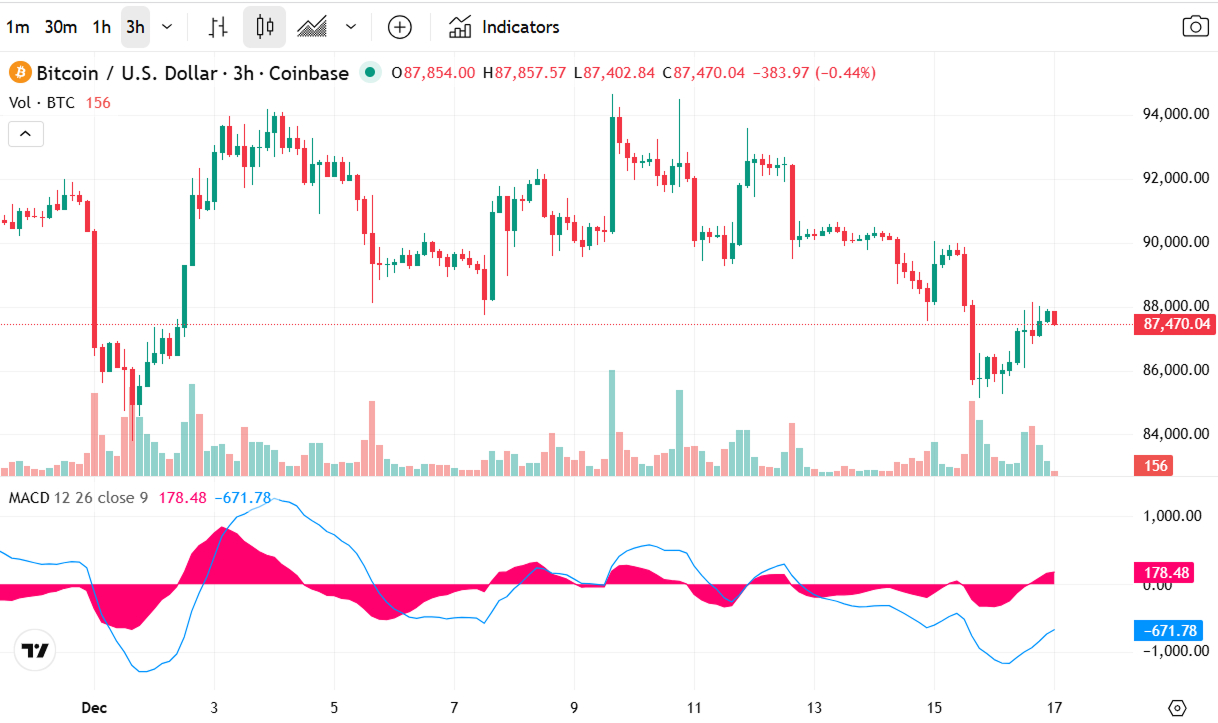
Why it matters: MACD helps you see momentum changes within a trend. Price might still be going up, but if MACD is making lower highs, it suggests the trend is losing steam even if price hasn't turned down yet.
RSI
RSI (Relative Strength Index) compares recent gains to recent losses.
The calculation: Over a set period (usually 14 days), calculate the average of up days and the average of down days. Then use a formula that creates a score from 0 to 100. The formula is: RSI = 100 - (100 / (1 + (average gain / average loss))).
What it shows: If recent gains are much larger than recent losses, RSI goes up (toward 100). If losses dominate, RSI goes down (toward 0). Readings above 70 suggest the asset might be overbought (too many gains recently). Readings below 30 suggest it might be oversold (too many losses recently).
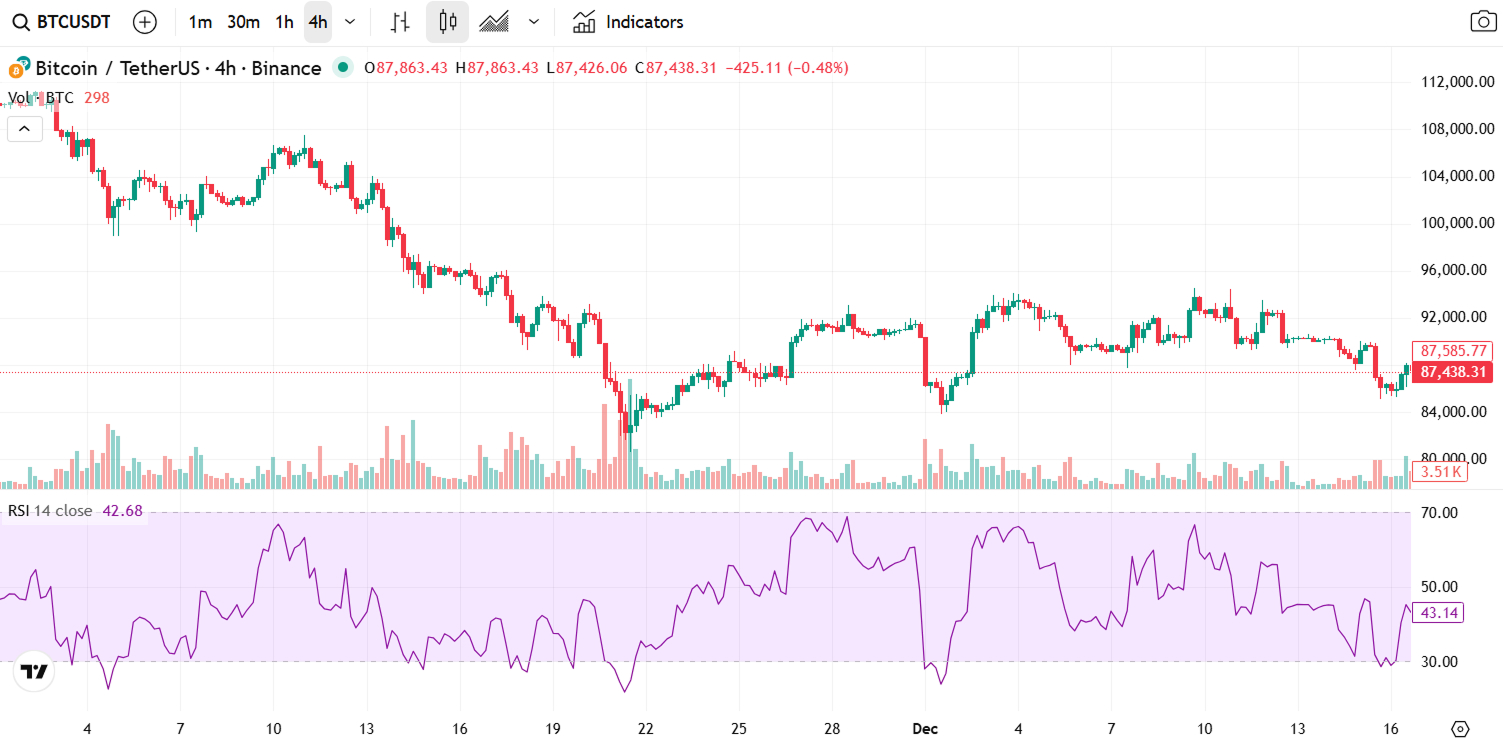
Why it matters: RSI helps identify when moves might be overextended. But remember that in strong trends, RSI can stay overbought or oversold for extended periods. It's not a perfect timing tool, but it helps gauge momentum strength.
Bollinger Bands
Bollinger Bands measure volatility by calculating how much prices typically deviate from average.
The calculation: Start with a moving average (usually 20 days). Then calculate the standard deviation, which is a measure of how spread out the prices are. The upper band is the moving average plus two standard deviations. The lower band is the moving average minus two standard deviations.
What it shows: When prices are volatile, the bands widen. When prices are stable, the bands contract. Price touching the upper band suggests prices are high relative to recent volatility. Price touching the lower band suggests prices are low relative to recent volatility.
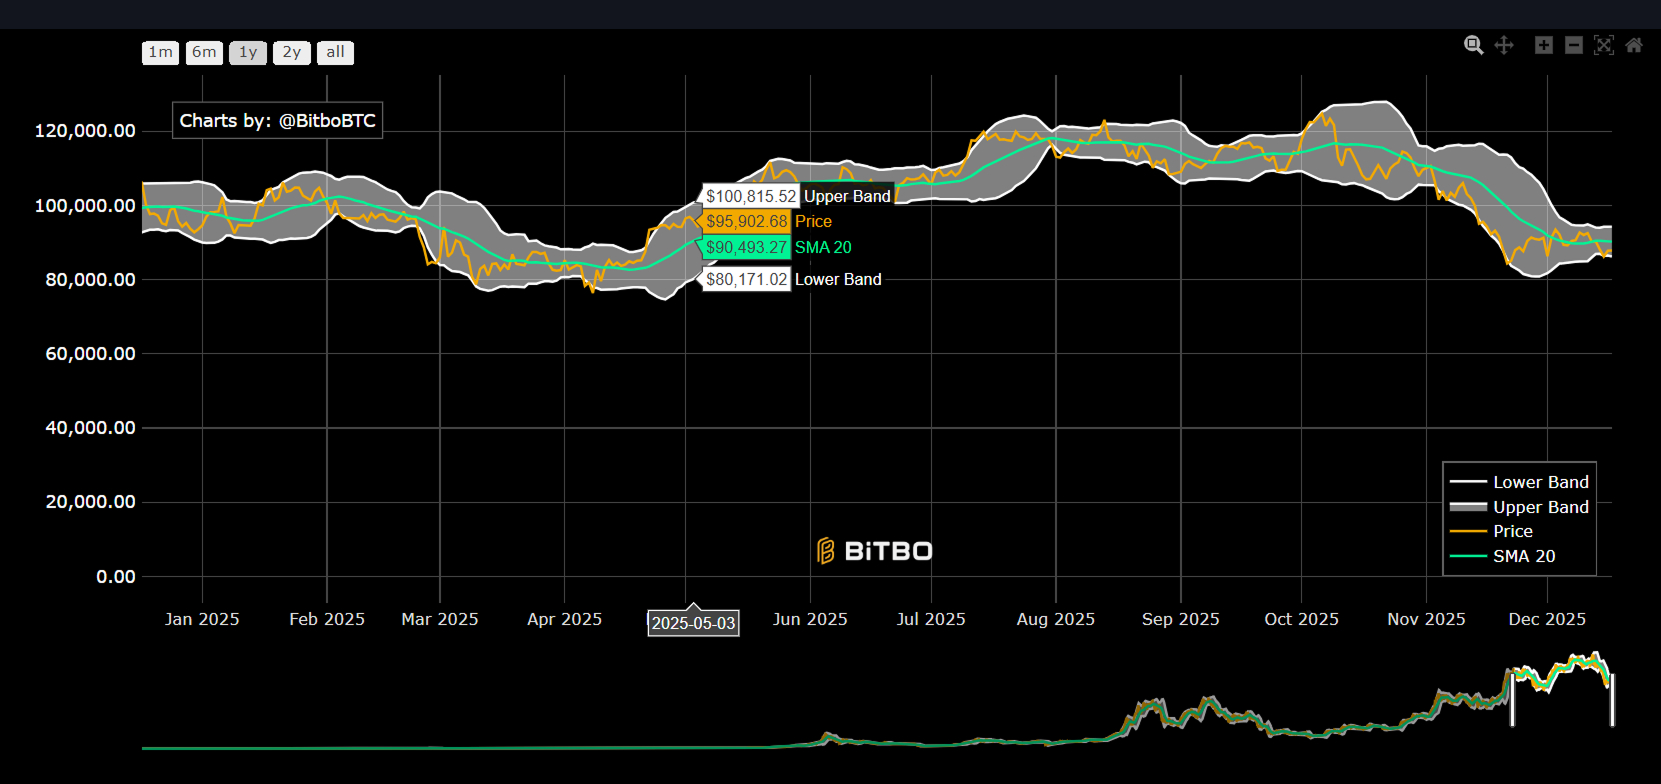
Why it matters: Bollinger Bands help you see volatility conditions. When bands contract (a "squeeze"), it often precedes explosive moves. When bands expand, it shows increased uncertainty. Price touching bands can signal potential reversal zones, but in strong trends, price can "walk the band" for extended periods.
Why indicators work: psychology and self-fulfilling prophecies
Here's the interesting part: indicators work partly because enough people believe they work. This creates a self-fulfilling prophecy where the indicator itself becomes meaningful simply because traders react to it.
The self-fulfilling nature:
When enough traders watch the same level, like the 200-day moving average or RSI 70, that level becomes significant because traders act on it. If Bitcoin approaches the 200-day MA and thousands of traders think "this is support, I'll buy here," their buying creates the support. The indicator didn't predict support. Instead, it created it through collective action.
This isn't necessarily bad. If enough market participants respect a level, it becomes meaningful regardless of its theoretical validity. The 200-day moving average works as support partly because traders expect it to work.
But there's more to it:
Indicators also work because they capture real patterns in human psychology. Bitcoin markets aren't random. They reflect the collective behavior of millions of people making decisions based on fear, greed, and pattern recognition.
The psychology of cycles:
Bitcoin's price cycles aren't just numbers on a chart. They're waves of human emotion playing out over years. Understanding this psychology helps explain why indicators work.
Accumulation phase (fear): After a major crash, most people are scared. They've lost money, seen negative news, and want nothing to do with Bitcoin. Prices are low, volume is low, and indicators like MVRV Z-Score show Bitcoin is undervalued relative to holder cost basis. This is when smart money accumulates, but most people are too afraid to buy.
Growth phase (hope): As prices recover, early buyers see profits. News turns positive. More people get interested. Moving averages start trending up, RSI moves from oversold to neutral. The trend becomes obvious, and momentum builds.
Euphoria phase (greed): Prices reach new highs. Everyone is talking about Bitcoin. Friends who never cared about crypto are asking for advice. Indicators like MVRV Z-Score show extreme overvaluation. RSI stays overbought for months. The Pi Cycle Top flashes warning signals. This is when most people want to buy, but it's often the worst time.
Distribution phase (denial): Prices start falling, but people who bought at the top don't want to sell at a loss. They hold, hoping for recovery. Indicators show weakening momentum, but many ignore the signals. Eventually, reality sets in, and the cycle repeats.
Why this matters for indicators:
Indicators work because they measure these psychological phases. When MVRV Z-Score is extremely high, it's not just a number. It reflects that most holders have large unrealized gains, creating psychological pressure to sell. When RSI stays overbought for months, it reflects the euphoria phase where people keep buying regardless of valuation.
Understanding that indicators measure psychology, not just price, helps you interpret them better. A high MVRV Z-Score doesn't just mean "overvalued." It means most people are sitting on large profits and feeling euphoric, which historically precedes major corrections.
Limitations: when indicators fail
No indicator is perfect. Understanding their limitations helps you use them more effectively and avoid costly mistakes.
Lag
Moving averages are lagging indicators. They tell you what the trend was, not what it will be. A 50-day moving average is the average of the last 50 days, which by definition means it's always looking backward. This means moving averages will always be late to signal trend changes. Price might have already turned, but the moving average hasn't caught up yet.
This lag is why many traders use multiple timeframes. A daily moving average might show an uptrend while a weekly moving average shows the trend is weakening. Understanding both gives you a more complete picture.
False signals in choppy markets
Most trend-following indicators (moving averages, MACD) work well in trending markets but generate false signals in sideways, choppy conditions. In consolidation phases, price can whipsaw around moving averages, creating multiple false breakouts.
RSI and other momentum oscillators can also give false signals in choppy markets, oscillating between overbought and oversold without clear direction. This is why many traders wait for clear trends before using trend-following indicators.
They don't predict news or macro shocks
Indicators process historical price and volume data. They can't predict sudden news events, regulatory changes, or macro-economic shocks that can move markets instantly.
If the Federal Reserve unexpectedly raises interest rates, or a major exchange gets hacked, indicators won't help you predict it. They're tools for reading market structure, not crystal balls for external events.
Overbought doesn't always mean "sell"
In strong uptrends, RSI can stay above 70 for weeks or months. Selling every time RSI hits 70 would cause you to exit strong trends early. Overbought conditions in uptrends often resolve through time (consolidation) rather than sharp reversals.
Similarly, oversold doesn't always mean "buy." In downtrends, RSI can stay below 30 for extended periods. Buying every time RSI hits 30 in a downtrend would catch falling knives.
Risk management is essential
Even the best indicators will generate false signals. This is why risk management, including position sizing, stop-losses, and not risking more than you can afford to lose, is more important than finding the perfect indicator.
Indicators improve your edge over time, but they don't eliminate risk. Understanding their limitations helps you use them as tools rather than guarantees.
A practical example: reading multiple indicators together
Let's walk through a real example of how to read multiple indicators together. Imagine Bitcoin's price has been trending up for several months, and you're trying to understand the current market structure.
The setup:
- Price action: Bitcoin is trading at $100,000, up from $60,000 three months ago
- 200-day moving average: Price is well above the 200-day MA (currently at $85,000), suggesting a strong uptrend
- MACD: The MACD line crossed above the signal line two months ago and has been rising since, showing momentum is building
- RSI: Currently at 75, suggesting overbought conditions
- Bollinger Bands: Price is touching the upper band, and the bands have been expanding, showing increased volatility
How to interpret this:
The trend indicators (moving average, MACD) are bullish. Price is above the 200-day MA, and MACD shows momentum is building. This suggests the uptrend is healthy and likely to continue.
However, the momentum indicator (RSI) and volatility indicator (Bollinger Bands) show the market might be overextended. RSI at 75 suggests recent gains have been strong, and price touching the upper Bollinger Band suggests prices are high relative to recent volatility.
What this means:
This is a classic "strong trend, but potentially overextended" scenario. The trend is intact (moving averages and MACD confirm), but short-term momentum might be running out of steam (RSI overbought, price at upper Bollinger Band).
Possible actions:
- If you're trend following: Stay positioned, but be aware that a pullback is possible. The trend is still up, so exiting now might mean missing further gains.
- If you're swing trading: Consider taking some profits. RSI overbought and price at upper Bollinger Band suggest a pullback might be coming. You could re-enter on a pullback to the moving average.
- If you're accumulating: This might not be the best entry point. Wait for a pullback when RSI returns to neutral (40-60) and price moves away from the upper Bollinger Band.
The key insight:
No single indicator tells the full story. The moving average and MACD say "trend is strong." RSI and Bollinger Bands say "but we might be overextended." Understanding both perspectives helps you make more informed decisions based on your objective.
How cycle indicators work differently
While most indicators analyze price and volume data, cycle indicators for Bitcoin work differently. They analyze on-chain data and long-term patterns to assess market structure from a different angle.
On-chain indicators
On-chain indicators look at data directly from the Bitcoin blockchain rather than just price action. This provides insights into holder behavior, network activity, and market structure that price charts can't show.
MVRV Z-Score compares Bitcoin's market capitalization to its realized capitalization. Realized cap values each coin at the price it last moved, providing a measure of the average cost basis of all Bitcoin holders. When MVRV is high, current holders have large unrealized gains, creating selling pressure. When MVRV is low, most holders are at a loss, reducing selling pressure.
Why this matters: MVRV reflects market psychology. High MVRV means euphoria, where people are sitting on large profits and feeling good. Low MVRV means fear, where people are at a loss and feeling bad. Historically, extreme MVRV readings have coincided with cycle tops and bottoms.
Puell Multiple compares daily miner revenue to the 365-day moving average. When Puell Multiple is high, miners are making more money than average, often coinciding with cycle tops as miners sell to lock in profits. When it's low, miner revenue is depressed, often coinciding with cycle bottoms.
Why this matters: Miners are a constant source of selling pressure (they need to sell Bitcoin to pay expenses). When they're making high profits, they sell more, adding supply to the market. When they're struggling, they sell less, reducing supply. This creates a natural cycle tied to mining profitability.
Pattern-based cycle indicators
Some cycle indicators identify patterns in long-term moving averages that have historically coincided with major turning points.
Pi Cycle Top uses the relationship between the 111-day and 350-day moving averages. When the 111-day MA crosses significantly above 2× the 350-day MA, it has historically signaled major cycle tops. This isn't predicting the future. Instead, it's identifying when price momentum has reached historically extreme levels relative to long-term averages.
Why this works: The Pi Cycle Top doesn't predict tops. Instead, it identifies when conditions match historical top patterns. When short-term momentum (111-day MA) is extremely elevated relative to long-term momentum (350-day MA), it suggests the market has reached unsustainable extremes. This often coincides with the euphoria phase of the cycle.
How cycle indicators complement price-based tools
Cycle indicators provide context that price-based indicators can't. While RSI might show overbought conditions, MVRV Z-Score tells you whether that overbought condition is happening at a cycle top or mid-cycle. While moving averages show trend direction, Pi Cycle Top tells you whether that trend is approaching historically extreme levels.
This multi-layered approach, using price indicators for timing and cycle indicators for context, helps you understand not just what's happening now, but where you are in the broader cycle. A high RSI reading during a cycle top is very different from a high RSI reading during mid-cycle growth.
For those building automated systems, APIs that provide pre-processed cycle indicators can simplify this analysis. HunchMachine's API includes endpoints like MVRV Z-Score, Pi Cycle Top, Halving Cycle, and Rainbow Chart that process on-chain and long-term pattern data, returning not just raw values but also interpreted summaries and cycle phase classifications.
These endpoints help you understand cycle positioning without needing to manually calculate moving averages, track halving dates, or process on-chain data yourself. They return context like "approaching cycle top" or "deep accumulation zone" that helps you understand where Bitcoin sits in its historical cycle pattern.
So… how do Bitcoin indicators work?
Bitcoin indicators work by processing historical price and volume data through mathematical formulas to reveal patterns, momentum shifts, and potential reversal zones. But they also work because enough traders watch them, creating self-fulfilling prophecies where the indicator itself becomes meaningful through collective action.
More fundamentally, indicators work because they measure human psychology playing out in market cycles. Bitcoin's price movements aren't random. They reflect waves of fear, hope, greed, and denial that repeat across cycles. Indicators like MVRV Z-Score and RSI quantify these psychological phases, helping you understand not just what's happening, but why.
Understanding the math helps you interpret what indicators are measuring. Understanding the psychology helps you understand why those measurements matter. A high MVRV Z-Score isn't just "overvalued." It means most people are euphoric and sitting on large profits, which historically precedes major corrections.
But indicators have limitations. They lag, they generate false signals in choppy markets, they can't predict news events, and they require risk management regardless of signal quality. No indicator is perfect, but used correctly, they help you read market structure and make more informed decisions. Once you understand how indicators work, the next step is figuring out what Bitcoin indicators you should use based on your specific objectives and trading style.
The question "How do Bitcoin indicators work?" stops being about memorizing formulas and becomes: "How do I use these tools to understand market psychology and structure, and how do I combine that understanding with risk management to make better decisions?"
Learn the basics, understand the psychology, respect the limitations, and use indicators as tools rather than guarantees. They won't predict the future, but they'll help you understand the present, and that's often enough to make better decisions.