How altseason works?

When people ask "How altseason works?", they're usually trying to understand the mechanics behind capital rotation from Bitcoin to altcoins, and how to recognize when this rotation is beginning, accelerating, or exhausting itself.
Altseason isn't a single event. It's a multi-phase process where capital flows from Bitcoin into altcoins in predictable stages, driven by market structure, risk appetite, and investor psychology. Understanding this framework helps you recognize where you are in the rotation cycle and position accordingly.
This article breaks down:
- The Altcoin Season Index and how it measures rotation
- The four phases of altseason progression
- Key metrics to track during each phase
- Practical tools for monitoring rotation in real time
The Altcoin Season Index: measuring rotation
The Altcoin Season Index is a simple but powerful metric that quantifies how many of the top 50 altcoins are outperforming Bitcoin over a 90-day window.
The index ranges from 0 to 100:
- 0–25: Bitcoin season. Bitcoin is outperforming most altcoins, and capital is concentrated in BTC.
- 25–75: Neutral phase. Mixed performance with no clear rotation pattern.
- 75–100: Altseason active. More than 75% of top altcoins are outperforming Bitcoin, indicating broad-based capital rotation.
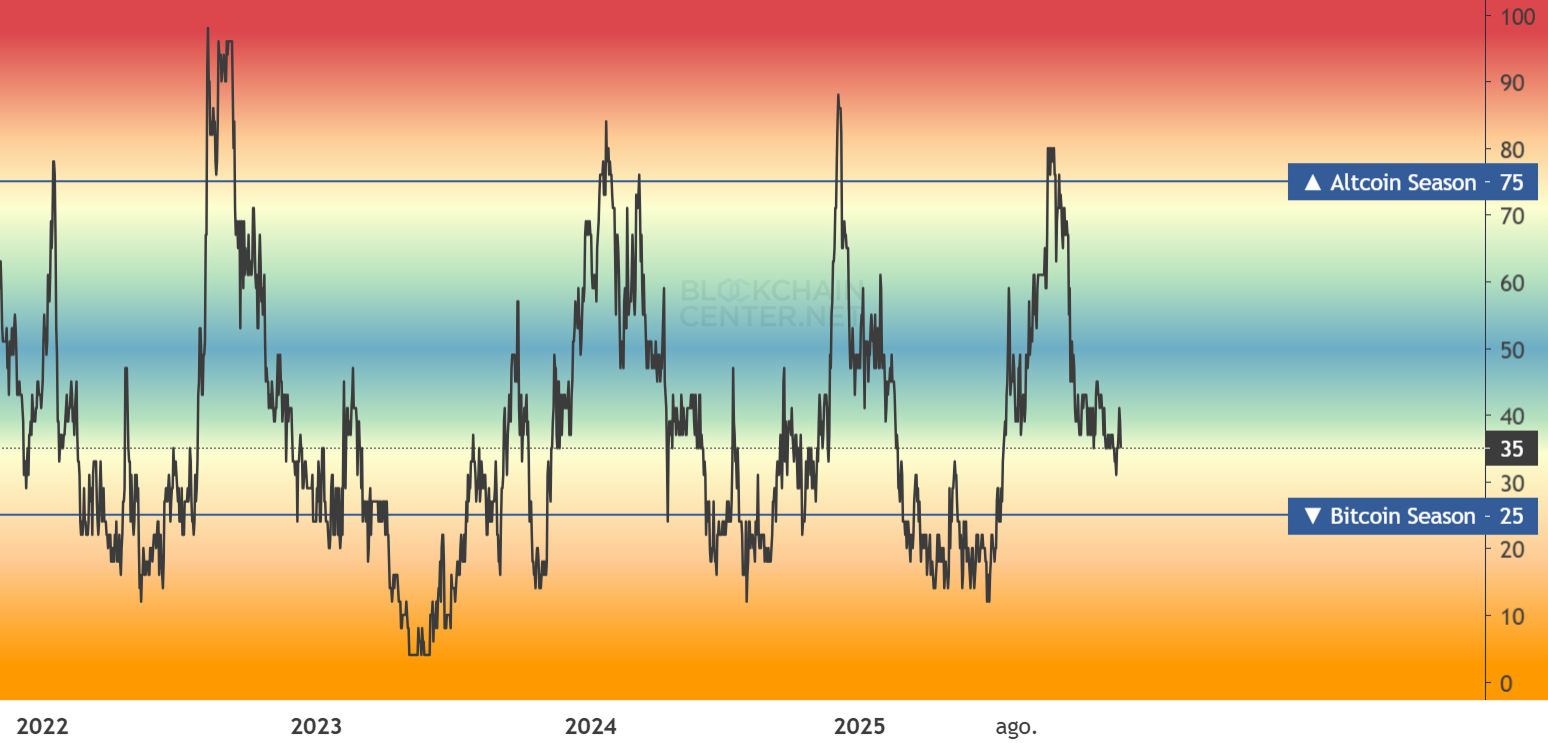
When the index crosses above 75 and stays there, it confirms that altseason is active. But the index is a lagging indicator. It confirms rotation that's already happened rather than predicting when altseason will start.
To detect rotation earlier, you need to monitor the underlying dynamics that drive the index: Bitcoin dominance trends, ETH/BTC ratio movements, and the breadth of altcoin outperformance. These metrics show rotation pressure building before the index confirms it.
The four phases of altseason
Altseason progresses through four distinct phases, each with characteristic market behavior. Understanding these phases helps you recognize where you are in the rotation cycle and what to expect next.
Phase 1: Bitcoin accumulation / High dominance
In this phase, Bitcoin is leading the market, and altcoins are lagging. Capital is concentrated in BTC, with investors preferring the relative safety and liquidity of Bitcoin over the higher risk and volatility of altcoins.
Market characteristics:
- Bitcoin dominance is elevated, typically above 60%
- Altcoins underperform Bitcoin consistently
- Low risk appetite, with capital flowing into "safe" assets
- Altcoin volume is low relative to Bitcoin volume
What to watch:
During this phase, you'll see Bitcoin dominance either rising or holding steady, typically staying above 60%. The ETH/BTC ratio (Ethereum's price relative to Bitcoin) is typically declining or flat, meaning Ethereum isn't yet outperforming. Market breadth is low, meaning few altcoins are beating Bitcoin's performance over the last 30 days.
This phase can last weeks or months, depending on how long Bitcoin's bull run continues and when investors start seeking higher returns in altcoins. During this period, altcoins often consolidate or decline even as Bitcoin rises, creating frustration for altcoin holders but setting up the next phase.
Phase 2: Large altcoins begin outperforming
Rotation begins when major altcoins like Ethereum, Solana, and other top-tier projects start outperforming Bitcoin. This is the first signal that capital is starting to flow from BTC into the altcoin market.
Market characteristics:
- Ethereum and other large-cap altcoins begin outperforming Bitcoin
- Bitcoin dominance starts declining from elevated levels
- ETH/BTC ratio begins rising
- DeFi and major layer-1 tokens show early strength
What to watch:
As rotation begins, you'll notice Bitcoin dominance starting to decline from elevated levels. The ETH/BTC ratio begins rising, meaning Ethereum is gaining strength relative to Bitcoin. Market breadth increases, with more altcoins starting to outperform Bitcoin over the last 30 days.
This is the critical transition phase where early detection gives you time to position before the broader altseason accelerates. The key is recognizing this shift early. While Bitcoin might still be making new highs, the fact that large altcoins are starting to outperform suggests that capital rotation has begun, even if it's not yet obvious to everyone.
Phase 3: Broad rally / Small-caps and memes surge
Once rotation gains momentum, it expands beyond large altcoins into mid-caps, small-caps, and eventually meme coins. This is when altseason becomes obvious to everyone, with altcoins across all market cap tiers participating in the rally.
Market characteristics:
- Bitcoin dominance falls below 50%, often reaching 40–45%
- Small-cap and mid-cap altcoins begin outperforming
- Meme coins and speculative projects see explosive moves
- Retail participation increases significantly
- Social media becomes dominated by altcoin discussions
What to watch:
By this phase, Bitcoin dominance has fallen significantly, often dropping below 50% and sometimes reaching 40–45%. Market breadth is high, with many altcoins outperforming Bitcoin over the last 30 days. The ETH/BTC ratio continues rising, and you'll see capital flowing into increasingly speculative projects.
This is where the most explosive moves occur, but it's also when risk increases significantly. This phase is characterized by FOMO, where every new project seems to pump regardless of fundamentals. While this can create massive gains, it also signals that the altseason is reaching its mature phase.
Phase 4: Extreme speculation / Peak euphoria
The final phase occurs when altseason reaches extreme levels. FOMO dominates, every new project pumps regardless of fundamentals, and the market becomes saturated with speculative capital.
Market characteristics:
- Altcoin Season Index stays above 75% for extended periods (3+ months)
- Bitcoin dominance finds a floor and begins stabilizing
- Extreme leverage in altcoin markets
- Retail investors who previously avoided crypto start buying altcoins
- Mainstream media coverage shifts to "altcoins are the future"
What to watch:
In this phase, you might notice Bitcoin dominance starting to flatten or even recover slightly, even while altcoin prices continue rising. This suggests that rotation is exhausting itself. Market breadth remains high, but the underlying momentum may start cooling. The Altcoin Season Index stays above 75% for extended periods, but the rate of change in dominance and momentum metrics may begin slowing.
Extreme leverage and retail FOMO create conditions where a small correction can trigger cascading liquidations. This phase is dangerous because it marks the peak of the altseason. While prices can continue rising for weeks or even months, the risk of a sharp reversal increases significantly. Recognizing saturation signals here helps you exit before the correction begins.
Key metrics for tracking rotation
To monitor altseason progression, you need to track several metrics simultaneously. No single metric tells the full story, but together they provide a comprehensive view of rotation dynamics.
Bitcoin dominance
Bitcoin dominance measures Bitcoin's share of total crypto market capitalization. When dominance falls, it signals that altcoins are collectively gaining market share. You can track this on charting platforms like TradingView. Look for dominance breaking below key levels like 60% or 50% as signals that rotation is accelerating. Historically, Bitcoin dominance has fallen to as low as 39% during the 2021 altseason, representing extreme capital rotation into altcoins.
ETH/BTC ratio
The ETH/BTC ratio measures Ethereum's performance relative to Bitcoin. When this ratio rises, it often signals that rotation is beginning, as Ethereum typically leads altcoin rallies. A rising ETH/BTC ratio combined with falling Bitcoin dominance is a strong early signal that rotation has begun. You can track this ratio on platforms like TradingView to monitor early rotation signals.
Market breadth
Market breadth measures how many altcoins are participating in the rally. You can calculate this by checking what percentage of the top 50 or top 100 altcoins are outperforming Bitcoin over a given period (typically 30 days). The Altcoin Season Index provides a ready-made calculation of this metric, showing when more than 75% of top altcoins are outperforming Bitcoin. High breadth (above 50%) indicates broad-based rotation, while low breadth suggests rotation is narrow and potentially unsustainable.
Rotation momentum
Rotation momentum measures how quickly capital is moving between Bitcoin, Ethereum, and altcoins. You can gauge this by looking at the rate of change in Bitcoin dominance, the speed of ETH/BTC ratio movements, and how quickly market breadth is expanding. High momentum suggests strong rotation pressure, while low momentum indicates the market is indecisive.
Risk appetite indicators
Other useful metrics include the Crypto Fear & Greed Index (extreme greed often coincides with altseason peaks), funding rates in altcoin derivatives markets (extremely positive funding suggests over-leverage), and on-chain metrics like exchange flows and holder behavior.
How to monitor rotation in real time
Tracking altseason manually requires monitoring multiple data sources, charts, and metrics simultaneously. You need to watch Bitcoin dominance charts, ETH/BTC ratio movements, calculate market breadth, and track rotation momentum across different timeframes. This is time-consuming and error-prone, especially when rotation signals can appear across different metrics and timeframes.
The challenge of manual tracking
The problem with manual tracking is that rotation signals don't always appear clearly. Bitcoin dominance might be falling, but is it a brief dip or the start of rotation? The ETH/BTC ratio might be rising, but is it sustainable? Market breadth might be increasing, but is it broad enough to signal altseason?
You need to process multiple data points simultaneously and understand how they interact. This requires constant monitoring, chart analysis, and calculation, which is difficult to maintain consistently.
Following rotation analysis
If you prefer a lighter approach to tracking rotation, you can follow accounts that monitor these dynamics and provide regular updates. The @InvestWithGPT account on X tracks all rotation phases in real time, monitoring Bitcoin dominance trends, ETH/BTC momentum, market breadth, and other rotation indicators. The account provides regular updates on where the market currently sits in the rotation cycle, alerting followers when early rotation signals appear or when altseason is beginning to form.
This approach gives you rotation context without needing to manually track charts or build your own monitoring system. The account synthesizes multiple rotation indicators and presents them in a clear, actionable format, helping you understand when conditions are shifting from BTC-led phases to early rotation and eventually to full altseason.
Automated rotation detection
This is where automated tools become valuable. Instead of manually tracking dominance charts, calculating breadth percentages, and monitoring ETH/BTC momentum, you can use APIs that process these metrics automatically and return a clear classification of the current rotation phase.
HunchMachine is a market data API that provides pre-processed indicators for tracking crypto market dynamics, including altseason rotation. The API has endpoints you can call via URL that automatically monitor Bitcoin dominance trends, ETH/BTC ratio momentum, and market breadth, then classify the current market into rotation phases.
The Altcoin Rotation Radar
One of HunchMachine's endpoints is called the Altcoin Rotation Radar. When you call this endpoint, it processes three key inputs:
- BTC dominance momentum — how Bitcoin's market share is changing over the last 30–90 days (smoothed to filter out daily noise)
- ETH/BTC ratio momentum — how Ethereum is performing relative to Bitcoin over the same period
- Market breadth — what percentage of the top altcoins are currently outperforming Bitcoin
The API processes these inputs and returns a simple classification: the current rotation phase (like "BTC-led," "ETH rotation," "early altseason," "full altseason," or "neutral"). It also includes a natural-language summary that describes the current market structure in plain English, like "BTC remains dominant; rotation paused" or "Rotation expanding into mid-caps; altseason building."
This makes it easy to understand rotation dynamics at a glance without needing to manually track multiple charts and calculate momentum trends yourself. You simply call the endpoint and get back a clear picture of where the market is in the rotation cycle.
Complementary indicators
The Altcoin Rotation Radar works best when combined with complementary indicators that provide additional context:
-
Altcoin Appetite Index: Measures how willing investors are to move money from Bitcoin into altcoins. Returns a score from 0 to 1, where scores above 0.6 indicate strong appetite and early altseason pressure.
-
Rotation Momentum Index: Tracks how quickly capital is moving between Bitcoin, Ethereum, and altcoins. Returns a momentum score (0 to 1) and a direction label (like "alt rotation" or "BTC rotation"), along with a summary explaining what the current momentum level means.
-
BTC Dominance Trend: Provides multi-timeframe context on dominance movements, showing short-term, medium-term, and long-term trends to help distinguish brief fluctuations from structural shifts.
Together, these endpoints provide a comprehensive view of rotation dynamics, helping you understand not just where you are in the cycle, but how quickly conditions are changing.
Identifying specific opportunities
Once you know altseason is active, you might want to identify which specific altcoins are showing the strongest setups. The Altcoin Opportunities endpoint scans the market and returns a ranked list of altcoins currently showing momentum, reversal patterns, or early signs of renewed interest. Each coin comes with a strength score and a brief interpretation explaining why it's flagged, helping you focus on the best opportunities rather than trying to catch every moving altcoin.
Automated workflows
For those who want to fully automate rotation monitoring, HunchMachine also provides pre-built automation workflows. The Altcoin Opportunities Detector automation combines these indicators into a single workflow that:
- Confirms the market is in a bull regime (via 50/200 MA trend)
- Detects when altseason is active (via Altcoin Rotation Radar)
- Identifies specific altcoin opportunities (via Altcoin Opportunities indicator)
The automation produces a formatted digest showing market status, overall altcoin momentum, average performance metrics, focus list of coins to watch, risk alert level, and a ranked list of top opportunity setups with strength scores and interpretations.
This transforms rotation monitoring from a manual, time-consuming process into an automated system that alerts you when conditions change, allowing you to focus on positioning rather than data collection.
So… how does altseason work?
Altseason works through a predictable four-phase rotation cycle: Bitcoin accumulation, large altcoin outperformance, broad rally expansion, and extreme speculation. Each phase has characteristic market behavior that helps you recognize where you are in the cycle.
The process is driven by capital flow from Bitcoin to altcoins, measured through metrics like Bitcoin dominance, ETH/BTC ratio, market breadth, and rotation momentum. These dynamics can be tracked manually through charts and calculations, or automatically through APIs that process the data and return clear phase classifications.
The key is building a system that tracks rotation signals in real time rather than trying to predict exact dates.
The key is building a system that tracks rotation signals in real time rather than trying to predict exact dates. Whether you track metrics manually or use automated tools, understanding the framework helps you recognize when conditions are shifting, allowing you to position accordingly.
The question "How does altseason work?" stops being about memorizing phases and becomes: "How do I build a system that detects rotation signals in real time and positions me to capture altseason opportunities while managing risk?" Understanding what triggers altseason helps you recognize when these rotation phases are beginning to form.
Monitor the metrics, understand the phases, and adjust your positioning as rotation signals accumulate. Altseason is a process, not an event. Your job is to recognize the process as it unfolds and position accordingly.